Portuguese vs Immigrants from Zimbabwe Currently Married
COMPARE
Portuguese
Immigrants from Zimbabwe
Currently Married
Currently Married Comparison
Portuguese
Immigrants from Zimbabwe
47.3%
CURRENTLY MARRIED
84.2/ 100
METRIC RATING
128th/ 347
METRIC RANK
46.7%
CURRENTLY MARRIED
52.4/ 100
METRIC RATING
171st/ 347
METRIC RANK
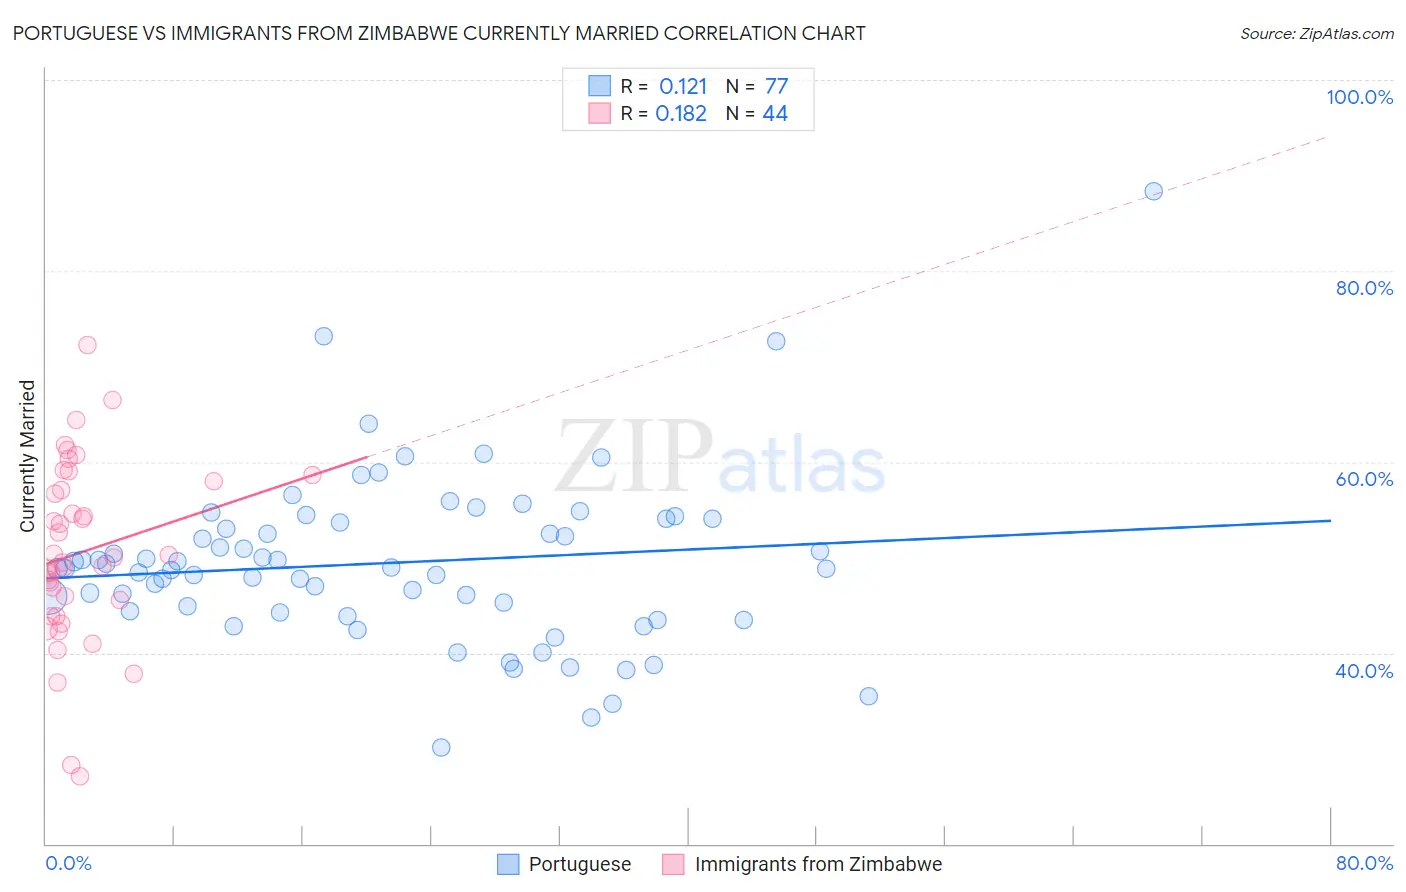
Portuguese vs Immigrants from Zimbabwe Currently Married Correlation Chart
The statistical analysis conducted on geographies consisting of 450,286,612 people shows a poor positive correlation between the proportion of Portuguese and percentage of population currently married in the United States with a correlation coefficient (R) of 0.121 and weighted average of 47.3%. Similarly, the statistical analysis conducted on geographies consisting of 117,813,548 people shows a poor positive correlation between the proportion of Immigrants from Zimbabwe and percentage of population currently married in the United States with a correlation coefficient (R) of 0.182 and weighted average of 46.7%, a difference of 1.4%.
Currently Married Correlation Summary
| Measurement | Portuguese | Immigrants from Zimbabwe |
| Minimum | 30.1% | 27.1% |
| Maximum | 88.3% | 72.3% |
| Range | 58.2% | 45.2% |
| Mean | 49.4% | 50.5% |
| Median | 48.9% | 49.7% |
| Interquartile 25% (IQ1) | 44.3% | 44.7% |
| Interquartile 75% (IQ3) | 53.9% | 57.6% |
| Interquartile Range (IQR) | 9.5% | 12.9% |
| Standard Deviation (Sample) | 8.9% | 9.3% |
| Standard Deviation (Population) | 8.9% | 9.2% |
Similar Demographics by Currently Married
Demographics Similar to Portuguese by Currently Married
In terms of currently married, the demographic groups most similar to Portuguese are New Zealander (47.4%, a difference of 0.040%), Immigrants from Jordan (47.4%, a difference of 0.050%), Sri Lankan (47.3%, a difference of 0.060%), Okinawan (47.4%, a difference of 0.080%), and Immigrants from Iraq (47.3%, a difference of 0.090%).
| Demographics | Rating | Rank | Currently Married |
| Immigrants | Croatia | 88.6 /100 | #121 | Excellent 47.5% |
| Osage | 87.9 /100 | #122 | Excellent 47.5% |
| Immigrants | Kazakhstan | 87.2 /100 | #123 | Excellent 47.4% |
| Laotians | 86.6 /100 | #124 | Excellent 47.4% |
| Okinawans | 85.3 /100 | #125 | Excellent 47.4% |
| Immigrants | Jordan | 84.9 /100 | #126 | Excellent 47.4% |
| New Zealanders | 84.9 /100 | #127 | Excellent 47.4% |
| Portuguese | 84.2 /100 | #128 | Excellent 47.3% |
| Sri Lankans | 83.2 /100 | #129 | Excellent 47.3% |
| Immigrants | Iraq | 82.8 /100 | #130 | Excellent 47.3% |
| Icelanders | 82.4 /100 | #131 | Excellent 47.3% |
| Afghans | 81.8 /100 | #132 | Excellent 47.3% |
| Immigrants | Malaysia | 81.1 /100 | #133 | Excellent 47.3% |
| Immigrants | Australia | 81.1 /100 | #134 | Excellent 47.3% |
| Immigrants | Norway | 79.7 /100 | #135 | Good 47.2% |
Demographics Similar to Immigrants from Zimbabwe by Currently Married
In terms of currently married, the demographic groups most similar to Immigrants from Zimbabwe are Aleut (46.7%, a difference of 0.010%), Tlingit-Haida (46.7%, a difference of 0.050%), Peruvian (46.6%, a difference of 0.090%), Immigrants from Brazil (46.6%, a difference of 0.090%), and Hawaiian (46.6%, a difference of 0.14%).
| Demographics | Rating | Rank | Currently Married |
| Immigrants | Western Asia | 64.2 /100 | #164 | Good 46.9% |
| Samoans | 59.8 /100 | #165 | Average 46.8% |
| Immigrants | Syria | 59.3 /100 | #166 | Average 46.8% |
| Spaniards | 58.8 /100 | #167 | Average 46.8% |
| Immigrants | Afghanistan | 58.2 /100 | #168 | Average 46.8% |
| Armenians | 58.2 /100 | #169 | Average 46.8% |
| Immigrants | Latvia | 56.7 /100 | #170 | Average 46.7% |
| Immigrants | Zimbabwe | 52.4 /100 | #171 | Average 46.7% |
| Aleuts | 52.0 /100 | #172 | Average 46.7% |
| Tlingit-Haida | 51.2 /100 | #173 | Average 46.7% |
| Peruvians | 50.0 /100 | #174 | Average 46.6% |
| Immigrants | Brazil | 49.9 /100 | #175 | Average 46.6% |
| Hawaiians | 48.6 /100 | #176 | Average 46.6% |
| Israelis | 48.6 /100 | #177 | Average 46.6% |
| Chickasaw | 47.8 /100 | #178 | Average 46.6% |