Basque vs Immigrants from Uzbekistan Currently Married
COMPARE
Basque
Immigrants from Uzbekistan
Currently Married
Currently Married Comparison
Basques
Immigrants from Uzbekistan
48.1%
CURRENTLY MARRIED
97.2/ 100
METRIC RATING
76th/ 347
METRIC RANK
46.9%
CURRENTLY MARRIED
66.0/ 100
METRIC RATING
160th/ 347
METRIC RANK
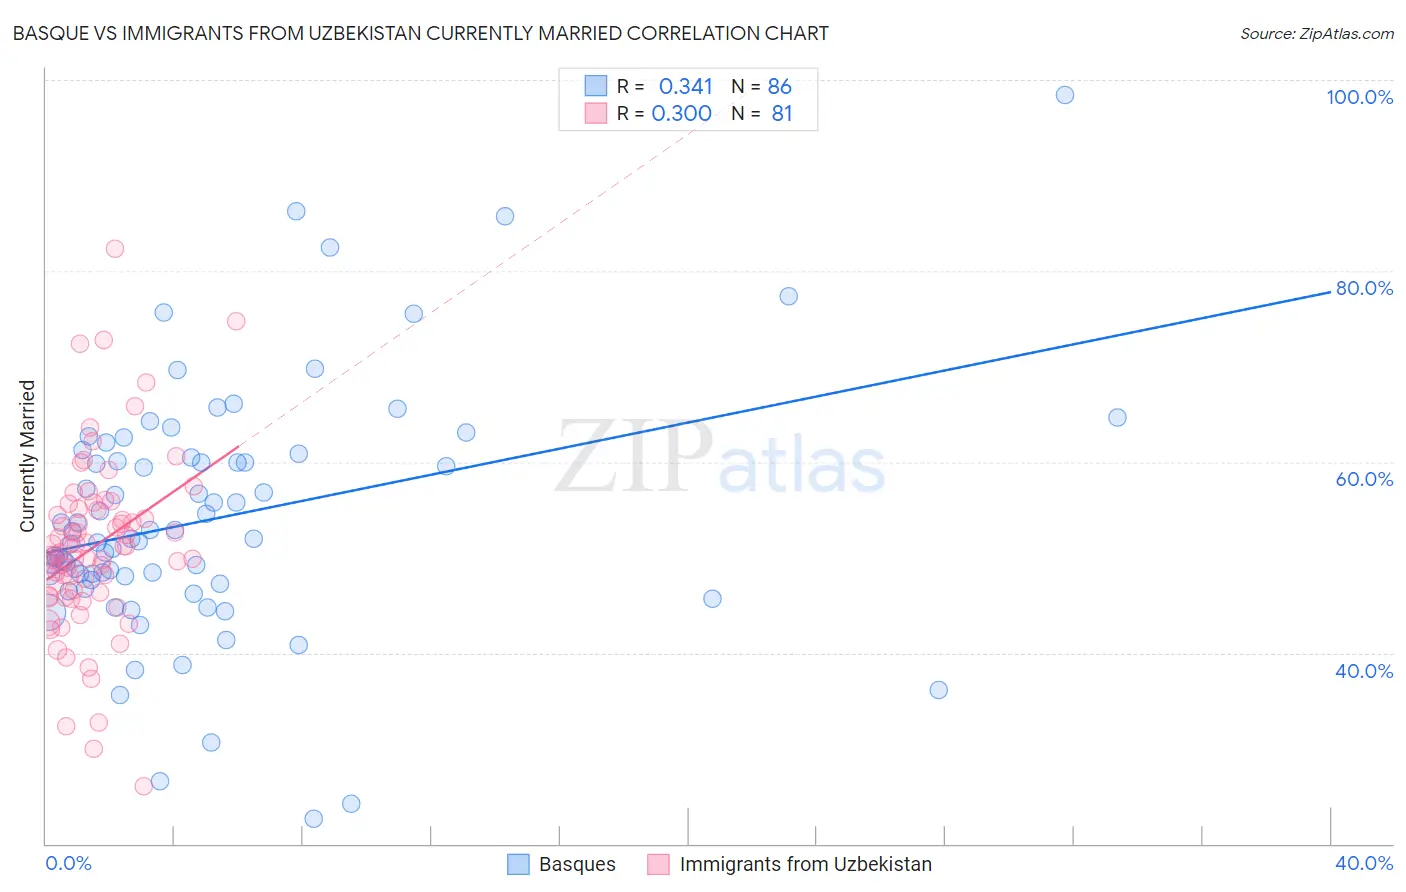
Basque vs Immigrants from Uzbekistan Currently Married Correlation Chart
The statistical analysis conducted on geographies consisting of 165,765,037 people shows a mild positive correlation between the proportion of Basques and percentage of population currently married in the United States with a correlation coefficient (R) of 0.341 and weighted average of 48.1%. Similarly, the statistical analysis conducted on geographies consisting of 118,761,741 people shows a mild positive correlation between the proportion of Immigrants from Uzbekistan and percentage of population currently married in the United States with a correlation coefficient (R) of 0.300 and weighted average of 46.9%, a difference of 2.6%.
Currently Married Correlation Summary
| Measurement | Basque | Immigrants from Uzbekistan |
| Minimum | 22.6% | 26.0% |
| Maximum | 98.4% | 82.3% |
| Range | 75.8% | 56.3% |
| Mean | 54.1% | 51.1% |
| Median | 52.0% | 50.5% |
| Interquartile 25% (IQ1) | 47.6% | 46.1% |
| Interquartile 75% (IQ3) | 60.5% | 55.0% |
| Interquartile Range (IQR) | 12.9% | 8.9% |
| Standard Deviation (Sample) | 12.9% | 9.3% |
| Standard Deviation (Population) | 12.9% | 9.3% |
Similar Demographics by Currently Married
Demographics Similar to Basques by Currently Married
In terms of currently married, the demographic groups most similar to Basques are Immigrants from Belarus (48.1%, a difference of 0.020%), Slovene (48.1%, a difference of 0.020%), Immigrants from Belgium (48.1%, a difference of 0.030%), Immigrants from South Africa (48.1%, a difference of 0.040%), and Immigrants from Poland (48.1%, a difference of 0.080%).
| Demographics | Rating | Rank | Currently Married |
| Canadians | 98.1 /100 | #69 | Exceptional 48.3% |
| Immigrants | Asia | 97.9 /100 | #70 | Exceptional 48.3% |
| Macedonians | 97.9 /100 | #71 | Exceptional 48.3% |
| Immigrants | Lebanon | 97.6 /100 | #72 | Exceptional 48.2% |
| Immigrants | Eastern Asia | 97.5 /100 | #73 | Exceptional 48.2% |
| Estonians | 97.4 /100 | #74 | Exceptional 48.2% |
| Immigrants | Belarus | 97.2 /100 | #75 | Exceptional 48.1% |
| Basques | 97.2 /100 | #76 | Exceptional 48.1% |
| Slovenes | 97.1 /100 | #77 | Exceptional 48.1% |
| Immigrants | Belgium | 97.1 /100 | #78 | Exceptional 48.1% |
| Immigrants | South Africa | 97.0 /100 | #79 | Exceptional 48.1% |
| Immigrants | Poland | 96.9 /100 | #80 | Exceptional 48.1% |
| Immigrants | Sri Lanka | 96.9 /100 | #81 | Exceptional 48.1% |
| Immigrants | Europe | 96.9 /100 | #82 | Exceptional 48.1% |
| Bolivians | 96.9 /100 | #83 | Exceptional 48.1% |
Demographics Similar to Immigrants from Uzbekistan by Currently Married
In terms of currently married, the demographic groups most similar to Immigrants from Uzbekistan are Immigrants from Southern Europe (46.9%, a difference of 0.0%), Iraqi (46.9%, a difference of 0.020%), Nonimmigrants (46.9%, a difference of 0.020%), Cherokee (46.9%, a difference of 0.030%), and Delaware (46.9%, a difference of 0.050%).
| Demographics | Rating | Rank | Currently Married |
| Immigrants | Venezuela | 68.6 /100 | #153 | Good 47.0% |
| Albanians | 68.6 /100 | #154 | Good 47.0% |
| Arabs | 68.6 /100 | #155 | Good 47.0% |
| Spanish | 68.1 /100 | #156 | Good 47.0% |
| Immigrants | Switzerland | 67.8 /100 | #157 | Good 46.9% |
| Cherokee | 66.8 /100 | #158 | Good 46.9% |
| Iraqis | 66.4 /100 | #159 | Good 46.9% |
| Immigrants | Uzbekistan | 66.0 /100 | #160 | Good 46.9% |
| Immigrants | Southern Europe | 65.9 /100 | #161 | Good 46.9% |
| Immigrants | Nonimmigrants | 65.4 /100 | #162 | Good 46.9% |
| Delaware | 64.7 /100 | #163 | Good 46.9% |
| Immigrants | Western Asia | 64.2 /100 | #164 | Good 46.9% |
| Samoans | 59.8 /100 | #165 | Average 46.8% |
| Immigrants | Syria | 59.3 /100 | #166 | Average 46.8% |
| Spaniards | 58.8 /100 | #167 | Average 46.8% |