Alsatian vs Immigrants from Zimbabwe Currently Married
COMPARE
Alsatian
Immigrants from Zimbabwe
Currently Married
Currently Married Comparison
Alsatians
Immigrants from Zimbabwe
45.7%
CURRENTLY MARRIED
10.8/ 100
METRIC RATING
208th/ 347
METRIC RANK
46.7%
CURRENTLY MARRIED
52.4/ 100
METRIC RATING
171st/ 347
METRIC RANK
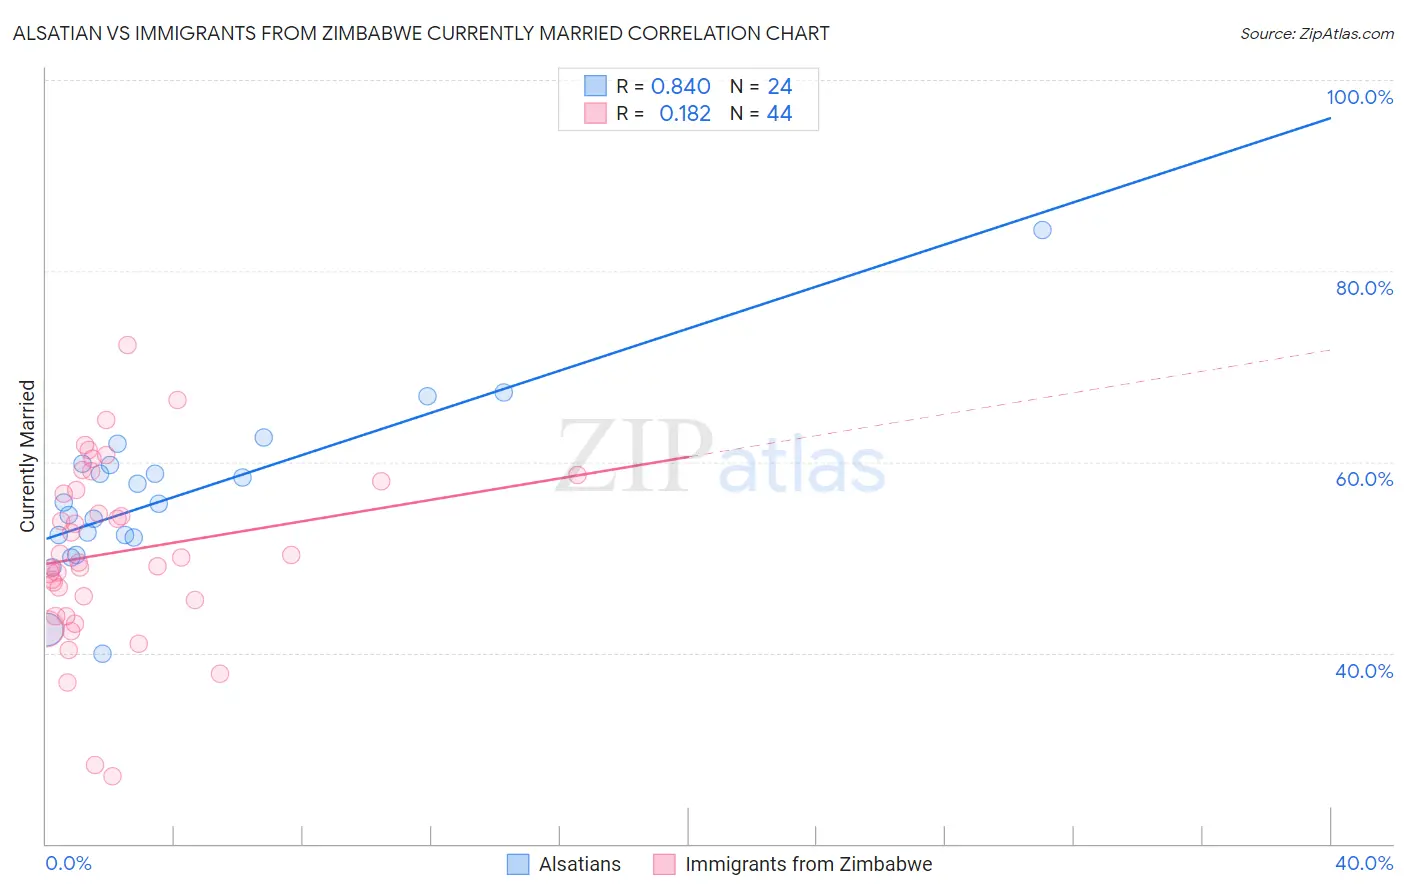
Alsatian vs Immigrants from Zimbabwe Currently Married Correlation Chart
The statistical analysis conducted on geographies consisting of 82,681,658 people shows a very strong positive correlation between the proportion of Alsatians and percentage of population currently married in the United States with a correlation coefficient (R) of 0.840 and weighted average of 45.7%. Similarly, the statistical analysis conducted on geographies consisting of 117,813,548 people shows a poor positive correlation between the proportion of Immigrants from Zimbabwe and percentage of population currently married in the United States with a correlation coefficient (R) of 0.182 and weighted average of 46.7%, a difference of 2.1%.
Currently Married Correlation Summary
| Measurement | Alsatian | Immigrants from Zimbabwe |
| Minimum | 39.9% | 27.1% |
| Maximum | 84.3% | 72.3% |
| Range | 44.4% | 45.2% |
| Mean | 56.5% | 50.5% |
| Median | 55.7% | 49.7% |
| Interquartile 25% (IQ1) | 52.2% | 44.7% |
| Interquartile 75% (IQ3) | 59.7% | 57.6% |
| Interquartile Range (IQR) | 7.5% | 12.9% |
| Standard Deviation (Sample) | 8.8% | 9.3% |
| Standard Deviation (Population) | 8.6% | 9.2% |
Similar Demographics by Currently Married
Demographics Similar to Alsatians by Currently Married
In terms of currently married, the demographic groups most similar to Alsatians are Immigrants from South America (45.7%, a difference of 0.010%), Immigrants (45.8%, a difference of 0.050%), South American Indian (45.8%, a difference of 0.070%), Immigrants from Spain (45.8%, a difference of 0.080%), and Taiwanese (45.8%, a difference of 0.090%).
| Demographics | Rating | Rank | Currently Married |
| Malaysians | 15.3 /100 | #201 | Poor 45.9% |
| Immigrants | Albania | 14.5 /100 | #202 | Poor 45.9% |
| Taiwanese | 11.7 /100 | #203 | Poor 45.8% |
| Immigrants | Spain | 11.6 /100 | #204 | Poor 45.8% |
| South American Indians | 11.5 /100 | #205 | Poor 45.8% |
| Immigrants | Immigrants | 11.2 /100 | #206 | Poor 45.8% |
| Immigrants | South America | 10.8 /100 | #207 | Poor 45.7% |
| Alsatians | 10.8 /100 | #208 | Poor 45.7% |
| Immigrants | Micronesia | 8.8 /100 | #209 | Tragic 45.6% |
| Uruguayans | 7.9 /100 | #210 | Tragic 45.6% |
| Houma | 7.2 /100 | #211 | Tragic 45.5% |
| Marshallese | 7.2 /100 | #212 | Tragic 45.5% |
| Alaska Natives | 7.0 /100 | #213 | Tragic 45.5% |
| Dutch West Indians | 6.7 /100 | #214 | Tragic 45.5% |
| German Russians | 6.7 /100 | #215 | Tragic 45.5% |
Demographics Similar to Immigrants from Zimbabwe by Currently Married
In terms of currently married, the demographic groups most similar to Immigrants from Zimbabwe are Aleut (46.7%, a difference of 0.010%), Tlingit-Haida (46.7%, a difference of 0.050%), Peruvian (46.6%, a difference of 0.090%), Immigrants from Brazil (46.6%, a difference of 0.090%), and Hawaiian (46.6%, a difference of 0.14%).
| Demographics | Rating | Rank | Currently Married |
| Immigrants | Western Asia | 64.2 /100 | #164 | Good 46.9% |
| Samoans | 59.8 /100 | #165 | Average 46.8% |
| Immigrants | Syria | 59.3 /100 | #166 | Average 46.8% |
| Spaniards | 58.8 /100 | #167 | Average 46.8% |
| Immigrants | Afghanistan | 58.2 /100 | #168 | Average 46.8% |
| Armenians | 58.2 /100 | #169 | Average 46.8% |
| Immigrants | Latvia | 56.7 /100 | #170 | Average 46.7% |
| Immigrants | Zimbabwe | 52.4 /100 | #171 | Average 46.7% |
| Aleuts | 52.0 /100 | #172 | Average 46.7% |
| Tlingit-Haida | 51.2 /100 | #173 | Average 46.7% |
| Peruvians | 50.0 /100 | #174 | Average 46.6% |
| Immigrants | Brazil | 49.9 /100 | #175 | Average 46.6% |
| Hawaiians | 48.6 /100 | #176 | Average 46.6% |
| Israelis | 48.6 /100 | #177 | Average 46.6% |
| Chickasaw | 47.8 /100 | #178 | Average 46.6% |