Immigrants from Caribbean vs Immigrants from Yemen Currently Married
COMPARE
Immigrants from Caribbean
Immigrants from Yemen
Currently Married
Currently Married Comparison
Immigrants from Caribbean
Immigrants from Yemen
41.3%
CURRENTLY MARRIED
0.0/ 100
METRIC RATING
316th/ 347
METRIC RANK
42.1%
CURRENTLY MARRIED
0.0/ 100
METRIC RATING
301st/ 347
METRIC RANK
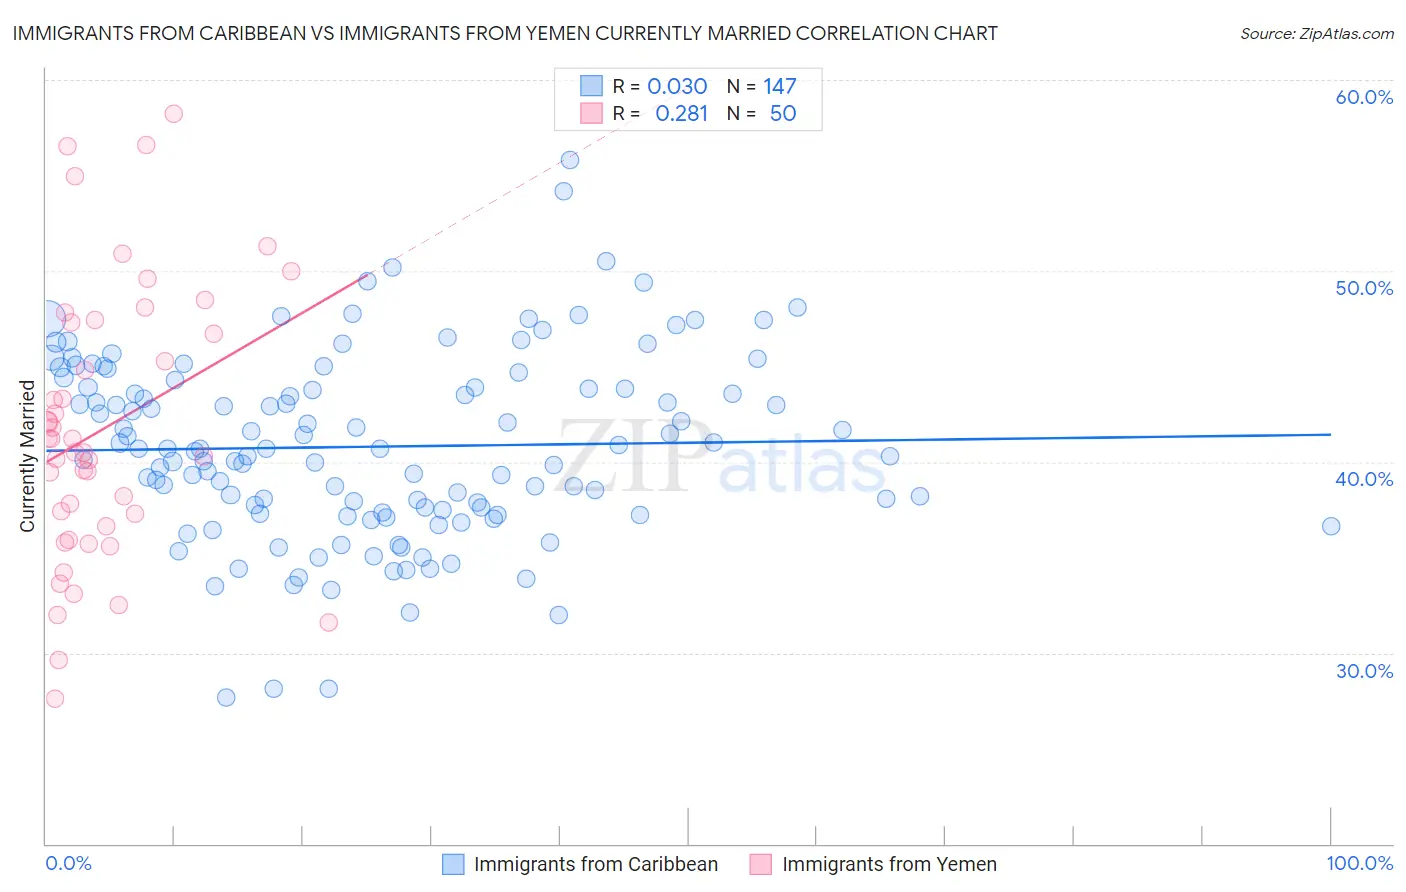
Immigrants from Caribbean vs Immigrants from Yemen Currently Married Correlation Chart
The statistical analysis conducted on geographies consisting of 450,001,379 people shows no correlation between the proportion of Immigrants from Caribbean and percentage of population currently married in the United States with a correlation coefficient (R) of 0.030 and weighted average of 41.3%. Similarly, the statistical analysis conducted on geographies consisting of 82,431,124 people shows a weak positive correlation between the proportion of Immigrants from Yemen and percentage of population currently married in the United States with a correlation coefficient (R) of 0.281 and weighted average of 42.1%, a difference of 1.9%.
Currently Married Correlation Summary
| Measurement | Immigrants from Caribbean | Immigrants from Yemen |
| Minimum | 27.6% | 27.6% |
| Maximum | 55.8% | 58.2% |
| Range | 28.2% | 30.6% |
| Mean | 40.8% | 41.7% |
| Median | 40.7% | 40.8% |
| Interquartile 25% (IQ1) | 37.3% | 36.6% |
| Interquartile 75% (IQ3) | 43.9% | 47.3% |
| Interquartile Range (IQR) | 6.6% | 10.7% |
| Standard Deviation (Sample) | 4.9% | 7.2% |
| Standard Deviation (Population) | 4.9% | 7.1% |
Demographics Similar to Immigrants from Caribbean and Immigrants from Yemen by Currently Married
In terms of currently married, the demographic groups most similar to Immigrants from Caribbean are Haitian (41.3%, a difference of 0.020%), Inupiat (41.3%, a difference of 0.060%), West Indian (41.3%, a difference of 0.15%), Bahamian (41.2%, a difference of 0.20%), and Jamaican (41.4%, a difference of 0.22%). Similarly, the demographic groups most similar to Immigrants from Yemen are Belizean (42.2%, a difference of 0.24%), Immigrants from Zaire (42.0%, a difference of 0.25%), Sioux (41.9%, a difference of 0.26%), Liberian (42.2%, a difference of 0.34%), and Immigrants from Honduras (42.2%, a difference of 0.37%).
| Demographics | Rating | Rank | Currently Married |
| Immigrants | Honduras | 0.0 /100 | #298 | Tragic 42.2% |
| Liberians | 0.0 /100 | #299 | Tragic 42.2% |
| Belizeans | 0.0 /100 | #300 | Tragic 42.2% |
| Immigrants | Yemen | 0.0 /100 | #301 | Tragic 42.1% |
| Immigrants | Zaire | 0.0 /100 | #302 | Tragic 42.0% |
| Sioux | 0.0 /100 | #303 | Tragic 41.9% |
| Immigrants | Bahamas | 0.0 /100 | #304 | Tragic 41.9% |
| Immigrants | Trinidad and Tobago | 0.0 /100 | #305 | Tragic 41.9% |
| Immigrants | Guyana | 0.0 /100 | #306 | Tragic 41.9% |
| Africans | 0.0 /100 | #307 | Tragic 41.8% |
| Immigrants | Belize | 0.0 /100 | #308 | Tragic 41.8% |
| Immigrants | Liberia | 0.0 /100 | #309 | Tragic 41.8% |
| Guyanese | 0.0 /100 | #310 | Tragic 41.6% |
| Trinidadians and Tobagonians | 0.0 /100 | #311 | Tragic 41.5% |
| Somalis | 0.0 /100 | #312 | Tragic 41.5% |
| Jamaicans | 0.0 /100 | #313 | Tragic 41.4% |
| West Indians | 0.0 /100 | #314 | Tragic 41.3% |
| Inupiat | 0.0 /100 | #315 | Tragic 41.3% |
| Immigrants | Caribbean | 0.0 /100 | #316 | Tragic 41.3% |
| Haitians | 0.0 /100 | #317 | Tragic 41.3% |
| Bahamians | 0.0 /100 | #318 | Tragic 41.2% |