Venezuelan vs Immigrants from Yemen Currently Married
COMPARE
Venezuelan
Immigrants from Yemen
Currently Married
Currently Married Comparison
Venezuelans
Immigrants from Yemen
47.1%
CURRENTLY MARRIED
74.4/ 100
METRIC RATING
141st/ 347
METRIC RANK
42.1%
CURRENTLY MARRIED
0.0/ 100
METRIC RATING
301st/ 347
METRIC RANK
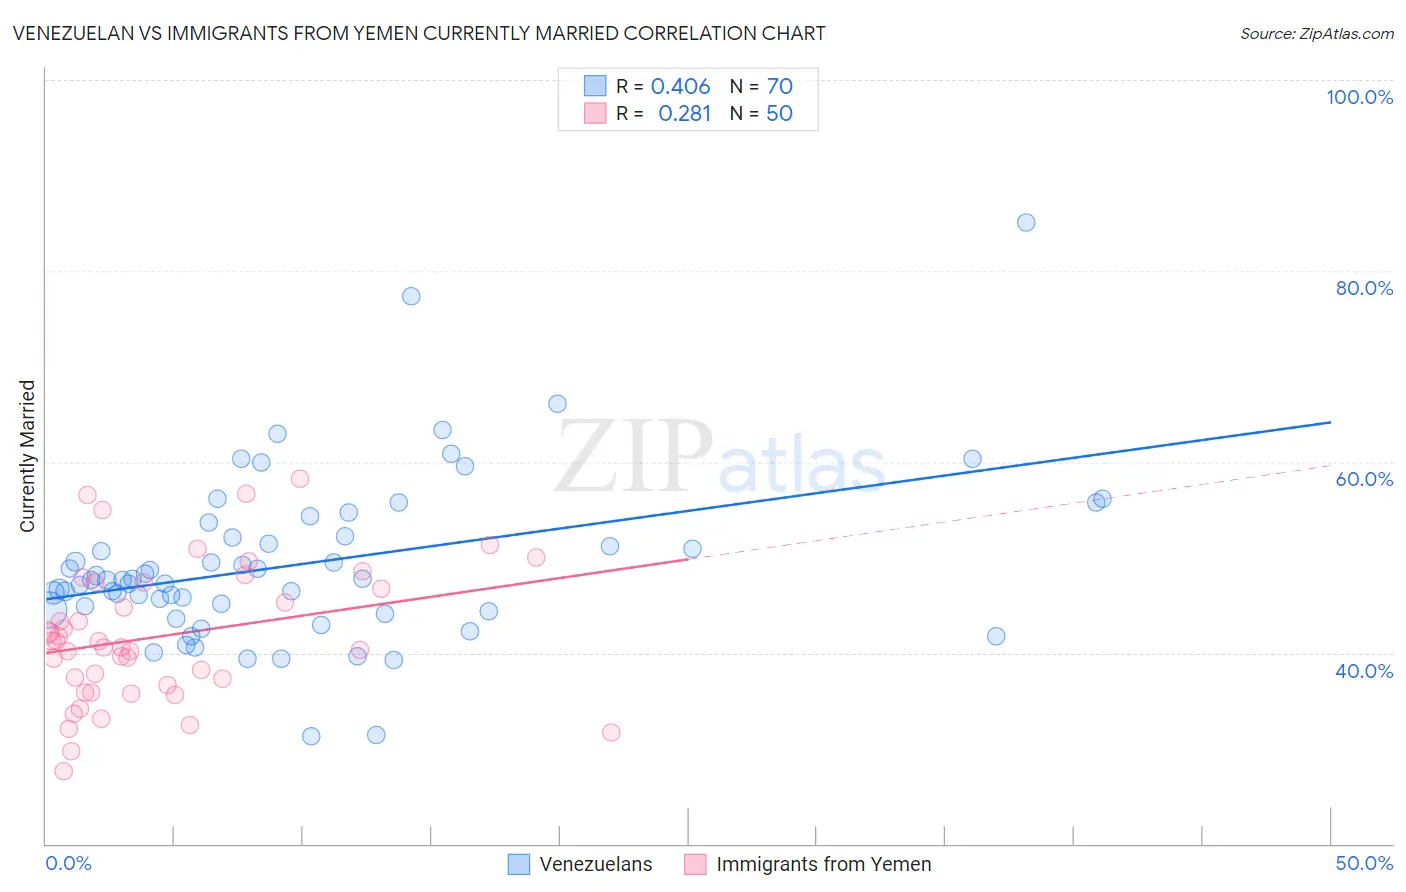
Venezuelan vs Immigrants from Yemen Currently Married Correlation Chart
The statistical analysis conducted on geographies consisting of 306,286,005 people shows a moderate positive correlation between the proportion of Venezuelans and percentage of population currently married in the United States with a correlation coefficient (R) of 0.406 and weighted average of 47.1%. Similarly, the statistical analysis conducted on geographies consisting of 82,431,124 people shows a weak positive correlation between the proportion of Immigrants from Yemen and percentage of population currently married in the United States with a correlation coefficient (R) of 0.281 and weighted average of 42.1%, a difference of 12.0%.
Currently Married Correlation Summary
| Measurement | Venezuelan | Immigrants from Yemen |
| Minimum | 31.2% | 27.6% |
| Maximum | 85.1% | 58.2% |
| Range | 53.9% | 30.6% |
| Mean | 49.3% | 41.7% |
| Median | 47.6% | 40.8% |
| Interquartile 25% (IQ1) | 44.5% | 36.6% |
| Interquartile 75% (IQ3) | 52.2% | 47.3% |
| Interquartile Range (IQR) | 7.7% | 10.7% |
| Standard Deviation (Sample) | 8.8% | 7.2% |
| Standard Deviation (Population) | 8.8% | 7.1% |
Similar Demographics by Currently Married
Demographics Similar to Venezuelans by Currently Married
In terms of currently married, the demographic groups most similar to Venezuelans are Argentinean (47.1%, a difference of 0.0%), Guamanian/Chamorro (47.1%, a difference of 0.010%), Cajun (47.1%, a difference of 0.040%), Hmong (47.1%, a difference of 0.050%), and Immigrants from South Eastern Asia (47.1%, a difference of 0.070%).
| Demographics | Rating | Rank | Currently Married |
| Immigrants | Australia | 81.1 /100 | #134 | Excellent 47.3% |
| Immigrants | Norway | 79.7 /100 | #135 | Good 47.2% |
| Immigrants | Vietnam | 78.2 /100 | #136 | Good 47.2% |
| Paraguayans | 77.8 /100 | #137 | Good 47.2% |
| Pakistanis | 77.5 /100 | #138 | Good 47.2% |
| Yugoslavians | 77.4 /100 | #139 | Good 47.2% |
| Cajuns | 75.3 /100 | #140 | Good 47.1% |
| Venezuelans | 74.4 /100 | #141 | Good 47.1% |
| Argentineans | 74.4 /100 | #142 | Good 47.1% |
| Guamanians/Chamorros | 74.2 /100 | #143 | Good 47.1% |
| Hmong | 73.4 /100 | #144 | Good 47.1% |
| Immigrants | South Eastern Asia | 72.9 /100 | #145 | Good 47.1% |
| Carpatho Rusyns | 72.6 /100 | #146 | Good 47.0% |
| Immigrants | Argentina | 72.0 /100 | #147 | Good 47.0% |
| Cambodians | 70.4 /100 | #148 | Good 47.0% |
Demographics Similar to Immigrants from Yemen by Currently Married
In terms of currently married, the demographic groups most similar to Immigrants from Yemen are Belizean (42.2%, a difference of 0.24%), Immigrants from Zaire (42.0%, a difference of 0.25%), Sioux (41.9%, a difference of 0.26%), Liberian (42.2%, a difference of 0.34%), and Immigrants from Honduras (42.2%, a difference of 0.37%).
| Demographics | Rating | Rank | Currently Married |
| Hondurans | 0.0 /100 | #294 | Tragic 42.5% |
| Immigrants | Western Africa | 0.0 /100 | #295 | Tragic 42.4% |
| Menominee | 0.0 /100 | #296 | Tragic 42.3% |
| Cheyenne | 0.0 /100 | #297 | Tragic 42.2% |
| Immigrants | Honduras | 0.0 /100 | #298 | Tragic 42.2% |
| Liberians | 0.0 /100 | #299 | Tragic 42.2% |
| Belizeans | 0.0 /100 | #300 | Tragic 42.2% |
| Immigrants | Yemen | 0.0 /100 | #301 | Tragic 42.1% |
| Immigrants | Zaire | 0.0 /100 | #302 | Tragic 42.0% |
| Sioux | 0.0 /100 | #303 | Tragic 41.9% |
| Immigrants | Bahamas | 0.0 /100 | #304 | Tragic 41.9% |
| Immigrants | Trinidad and Tobago | 0.0 /100 | #305 | Tragic 41.9% |
| Immigrants | Guyana | 0.0 /100 | #306 | Tragic 41.9% |
| Africans | 0.0 /100 | #307 | Tragic 41.8% |
| Immigrants | Belize | 0.0 /100 | #308 | Tragic 41.8% |