Spanish American vs Immigrants from Yemen Currently Married
COMPARE
Spanish American
Immigrants from Yemen
Currently Married
Currently Married Comparison
Spanish Americans
Immigrants from Yemen
45.0%
CURRENTLY MARRIED
2.1/ 100
METRIC RATING
227th/ 347
METRIC RANK
42.1%
CURRENTLY MARRIED
0.0/ 100
METRIC RATING
301st/ 347
METRIC RANK
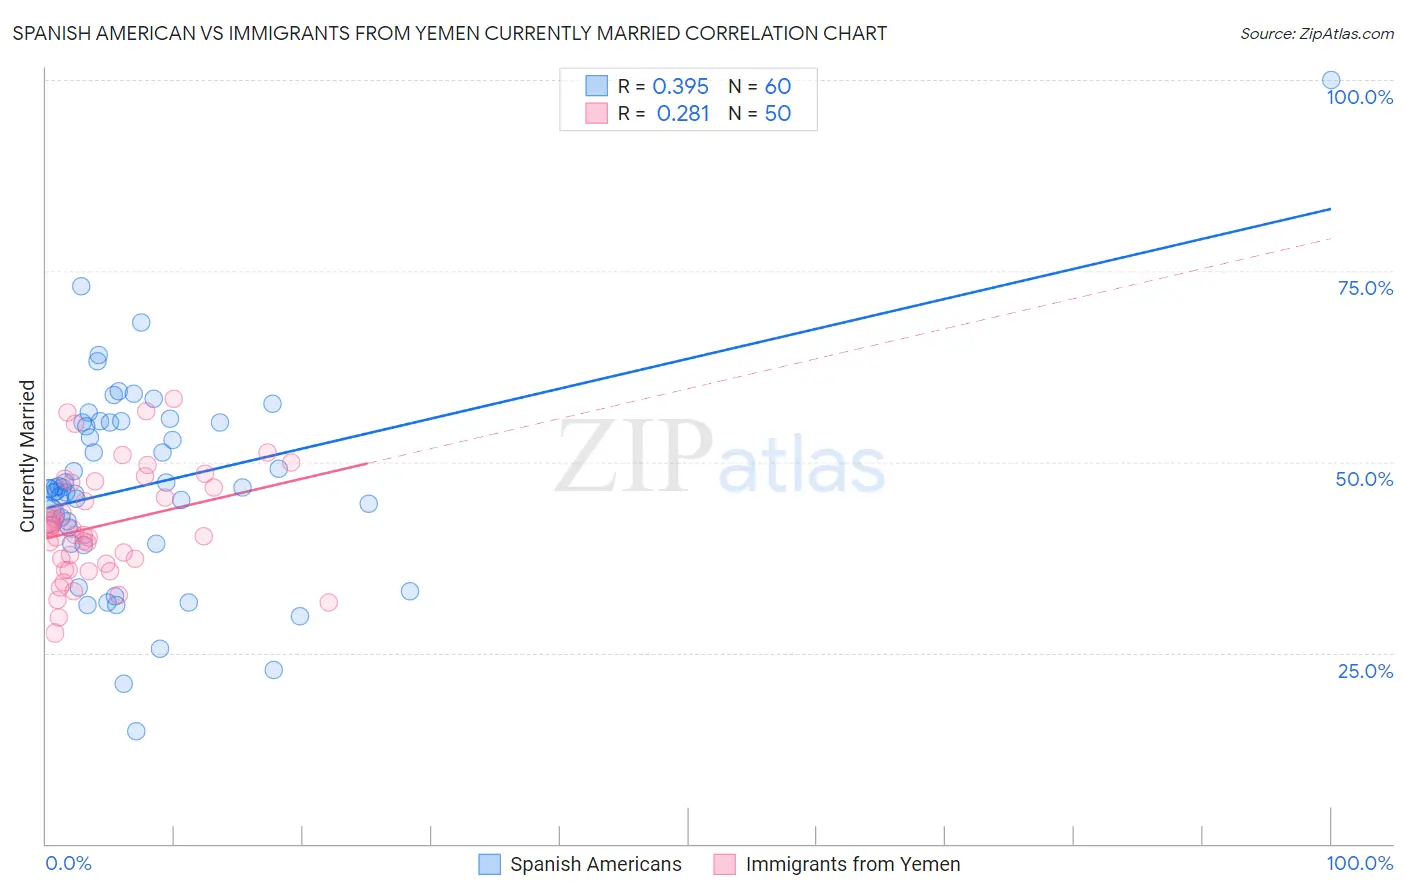
Spanish American vs Immigrants from Yemen Currently Married Correlation Chart
The statistical analysis conducted on geographies consisting of 103,168,407 people shows a mild positive correlation between the proportion of Spanish Americans and percentage of population currently married in the United States with a correlation coefficient (R) of 0.395 and weighted average of 45.0%. Similarly, the statistical analysis conducted on geographies consisting of 82,431,124 people shows a weak positive correlation between the proportion of Immigrants from Yemen and percentage of population currently married in the United States with a correlation coefficient (R) of 0.281 and weighted average of 42.1%, a difference of 7.0%.
Currently Married Correlation Summary
| Measurement | Spanish American | Immigrants from Yemen |
| Minimum | 14.8% | 27.6% |
| Maximum | 100.0% | 58.2% |
| Range | 85.2% | 30.6% |
| Mean | 47.0% | 41.7% |
| Median | 46.6% | 40.8% |
| Interquartile 25% (IQ1) | 40.4% | 36.6% |
| Interquartile 75% (IQ3) | 55.2% | 47.3% |
| Interquartile Range (IQR) | 14.8% | 10.7% |
| Standard Deviation (Sample) | 13.5% | 7.2% |
| Standard Deviation (Population) | 13.4% | 7.1% |
Similar Demographics by Currently Married
Demographics Similar to Spanish Americans by Currently Married
In terms of currently married, the demographic groups most similar to Spanish Americans are Comanche (45.0%, a difference of 0.0%), Immigrants from Uruguay (45.0%, a difference of 0.0%), French American Indian (45.0%, a difference of 0.050%), Immigrants from Uganda (45.0%, a difference of 0.060%), and Immigrants from Laos (45.0%, a difference of 0.10%).
| Demographics | Rating | Rank | Currently Married |
| Kenyans | 3.1 /100 | #220 | Tragic 45.2% |
| Mexicans | 3.0 /100 | #221 | Tragic 45.2% |
| Immigrants | Azores | 2.5 /100 | #222 | Tragic 45.1% |
| Immigrants | Laos | 2.3 /100 | #223 | Tragic 45.0% |
| Immigrants | Uganda | 2.2 /100 | #224 | Tragic 45.0% |
| French American Indians | 2.2 /100 | #225 | Tragic 45.0% |
| Comanche | 2.1 /100 | #226 | Tragic 45.0% |
| Spanish Americans | 2.1 /100 | #227 | Tragic 45.0% |
| Immigrants | Uruguay | 2.0 /100 | #228 | Tragic 45.0% |
| Cree | 1.7 /100 | #229 | Tragic 44.9% |
| Immigrants | Kenya | 1.6 /100 | #230 | Tragic 44.9% |
| Immigrants | Panama | 1.5 /100 | #231 | Tragic 44.9% |
| Nepalese | 1.2 /100 | #232 | Tragic 44.7% |
| Immigrants | Saudi Arabia | 1.1 /100 | #233 | Tragic 44.7% |
| Iroquois | 1.1 /100 | #234 | Tragic 44.7% |
Demographics Similar to Immigrants from Yemen by Currently Married
In terms of currently married, the demographic groups most similar to Immigrants from Yemen are Belizean (42.2%, a difference of 0.24%), Immigrants from Zaire (42.0%, a difference of 0.25%), Sioux (41.9%, a difference of 0.26%), Liberian (42.2%, a difference of 0.34%), and Immigrants from Honduras (42.2%, a difference of 0.37%).
| Demographics | Rating | Rank | Currently Married |
| Hondurans | 0.0 /100 | #294 | Tragic 42.5% |
| Immigrants | Western Africa | 0.0 /100 | #295 | Tragic 42.4% |
| Menominee | 0.0 /100 | #296 | Tragic 42.3% |
| Cheyenne | 0.0 /100 | #297 | Tragic 42.2% |
| Immigrants | Honduras | 0.0 /100 | #298 | Tragic 42.2% |
| Liberians | 0.0 /100 | #299 | Tragic 42.2% |
| Belizeans | 0.0 /100 | #300 | Tragic 42.2% |
| Immigrants | Yemen | 0.0 /100 | #301 | Tragic 42.1% |
| Immigrants | Zaire | 0.0 /100 | #302 | Tragic 42.0% |
| Sioux | 0.0 /100 | #303 | Tragic 41.9% |
| Immigrants | Bahamas | 0.0 /100 | #304 | Tragic 41.9% |
| Immigrants | Trinidad and Tobago | 0.0 /100 | #305 | Tragic 41.9% |
| Immigrants | Guyana | 0.0 /100 | #306 | Tragic 41.9% |
| Africans | 0.0 /100 | #307 | Tragic 41.8% |
| Immigrants | Belize | 0.0 /100 | #308 | Tragic 41.8% |