Senegalese vs Immigrants from Yemen Currently Married
COMPARE
Senegalese
Immigrants from Yemen
Currently Married
Currently Married Comparison
Senegalese
Immigrants from Yemen
40.6%
CURRENTLY MARRIED
0.0/ 100
METRIC RATING
327th/ 347
METRIC RANK
42.1%
CURRENTLY MARRIED
0.0/ 100
METRIC RATING
301st/ 347
METRIC RANK
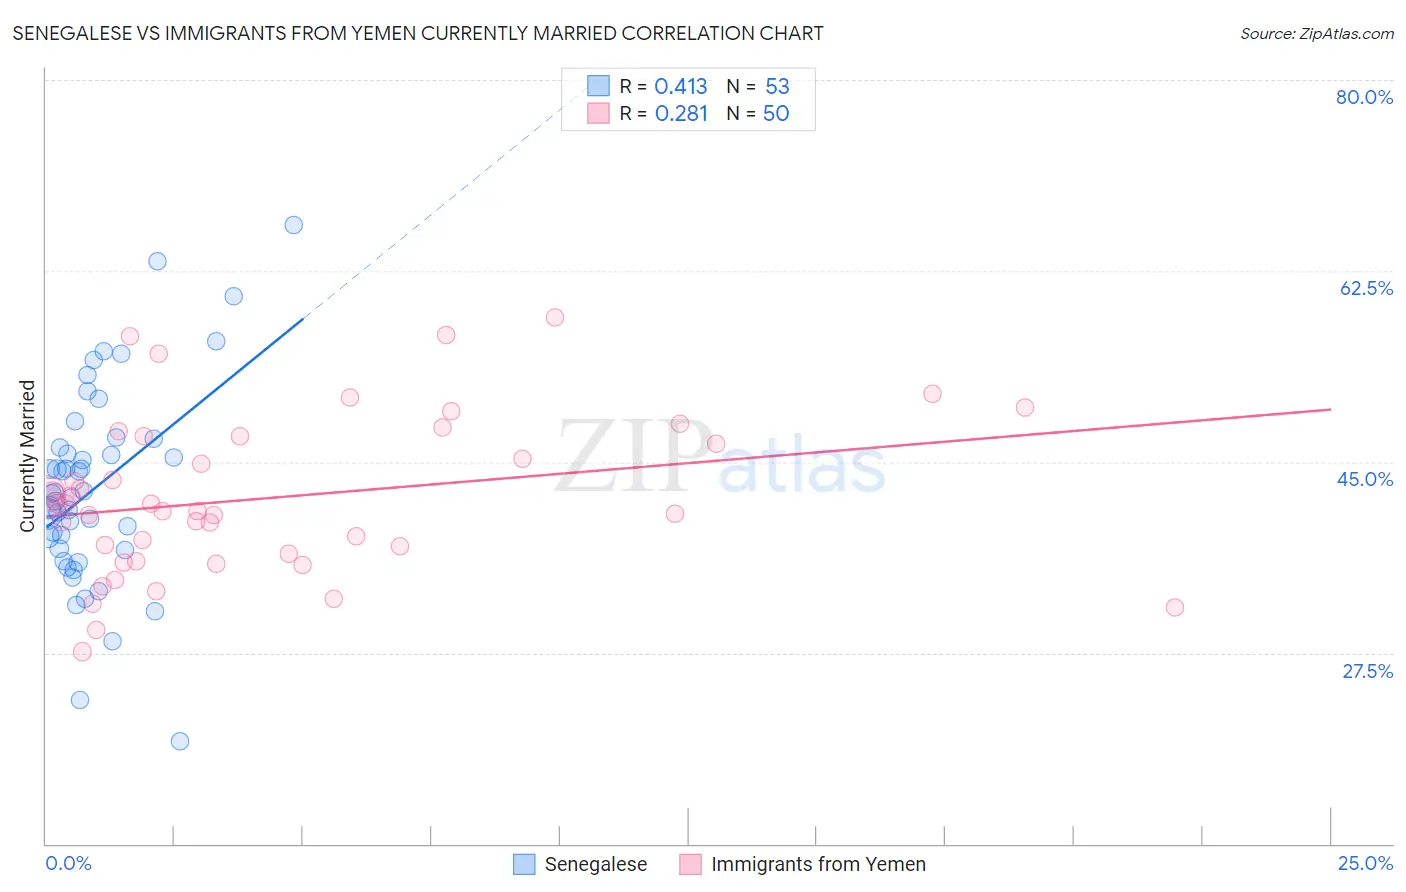
Senegalese vs Immigrants from Yemen Currently Married Correlation Chart
The statistical analysis conducted on geographies consisting of 78,135,474 people shows a moderate positive correlation between the proportion of Senegalese and percentage of population currently married in the United States with a correlation coefficient (R) of 0.413 and weighted average of 40.6%. Similarly, the statistical analysis conducted on geographies consisting of 82,431,124 people shows a weak positive correlation between the proportion of Immigrants from Yemen and percentage of population currently married in the United States with a correlation coefficient (R) of 0.281 and weighted average of 42.1%, a difference of 3.7%.
Currently Married Correlation Summary
| Measurement | Senegalese | Immigrants from Yemen |
| Minimum | 19.4% | 27.6% |
| Maximum | 66.7% | 58.2% |
| Range | 47.3% | 30.6% |
| Mean | 42.6% | 41.7% |
| Median | 42.1% | 40.8% |
| Interquartile 25% (IQ1) | 37.0% | 36.6% |
| Interquartile 75% (IQ3) | 46.7% | 47.3% |
| Interquartile Range (IQR) | 9.7% | 10.7% |
| Standard Deviation (Sample) | 9.1% | 7.2% |
| Standard Deviation (Population) | 9.0% | 7.1% |
Similar Demographics by Currently Married
Demographics Similar to Senegalese by Currently Married
In terms of currently married, the demographic groups most similar to Senegalese are Arapaho (40.5%, a difference of 0.040%), Barbadian (40.6%, a difference of 0.17%), U.S. Virgin Islander (40.7%, a difference of 0.31%), Immigrants from Senegal (40.7%, a difference of 0.36%), and Immigrants from West Indies (40.7%, a difference of 0.37%).
| Demographics | Rating | Rank | Currently Married |
| Immigrants | Jamaica | 0.0 /100 | #320 | Tragic 41.1% |
| Immigrants | Congo | 0.0 /100 | #321 | Tragic 41.1% |
| Immigrants | Haiti | 0.0 /100 | #322 | Tragic 41.0% |
| Immigrants | West Indies | 0.0 /100 | #323 | Tragic 40.7% |
| Immigrants | Senegal | 0.0 /100 | #324 | Tragic 40.7% |
| U.S. Virgin Islanders | 0.0 /100 | #325 | Tragic 40.7% |
| Barbadians | 0.0 /100 | #326 | Tragic 40.6% |
| Senegalese | 0.0 /100 | #327 | Tragic 40.6% |
| Arapaho | 0.0 /100 | #328 | Tragic 40.5% |
| Crow | 0.0 /100 | #329 | Tragic 40.4% |
| Immigrants | Dominica | 0.0 /100 | #330 | Tragic 40.3% |
| Immigrants | Barbados | 0.0 /100 | #331 | Tragic 40.3% |
| Immigrants | St. Vincent and the Grenadines | 0.0 /100 | #332 | Tragic 40.1% |
| Yup'ik | 0.0 /100 | #333 | Tragic 39.9% |
| Puerto Ricans | 0.0 /100 | #334 | Tragic 39.9% |
Demographics Similar to Immigrants from Yemen by Currently Married
In terms of currently married, the demographic groups most similar to Immigrants from Yemen are Belizean (42.2%, a difference of 0.24%), Immigrants from Zaire (42.0%, a difference of 0.25%), Sioux (41.9%, a difference of 0.26%), Liberian (42.2%, a difference of 0.34%), and Immigrants from Honduras (42.2%, a difference of 0.37%).
| Demographics | Rating | Rank | Currently Married |
| Hondurans | 0.0 /100 | #294 | Tragic 42.5% |
| Immigrants | Western Africa | 0.0 /100 | #295 | Tragic 42.4% |
| Menominee | 0.0 /100 | #296 | Tragic 42.3% |
| Cheyenne | 0.0 /100 | #297 | Tragic 42.2% |
| Immigrants | Honduras | 0.0 /100 | #298 | Tragic 42.2% |
| Liberians | 0.0 /100 | #299 | Tragic 42.2% |
| Belizeans | 0.0 /100 | #300 | Tragic 42.2% |
| Immigrants | Yemen | 0.0 /100 | #301 | Tragic 42.1% |
| Immigrants | Zaire | 0.0 /100 | #302 | Tragic 42.0% |
| Sioux | 0.0 /100 | #303 | Tragic 41.9% |
| Immigrants | Bahamas | 0.0 /100 | #304 | Tragic 41.9% |
| Immigrants | Trinidad and Tobago | 0.0 /100 | #305 | Tragic 41.9% |
| Immigrants | Guyana | 0.0 /100 | #306 | Tragic 41.9% |
| Africans | 0.0 /100 | #307 | Tragic 41.8% |
| Immigrants | Belize | 0.0 /100 | #308 | Tragic 41.8% |