Liberian vs Immigrants from Yemen Currently Married
COMPARE
Liberian
Immigrants from Yemen
Currently Married
Currently Married Comparison
Liberians
Immigrants from Yemen
42.2%
CURRENTLY MARRIED
0.0/ 100
METRIC RATING
299th/ 347
METRIC RANK
42.1%
CURRENTLY MARRIED
0.0/ 100
METRIC RATING
301st/ 347
METRIC RANK
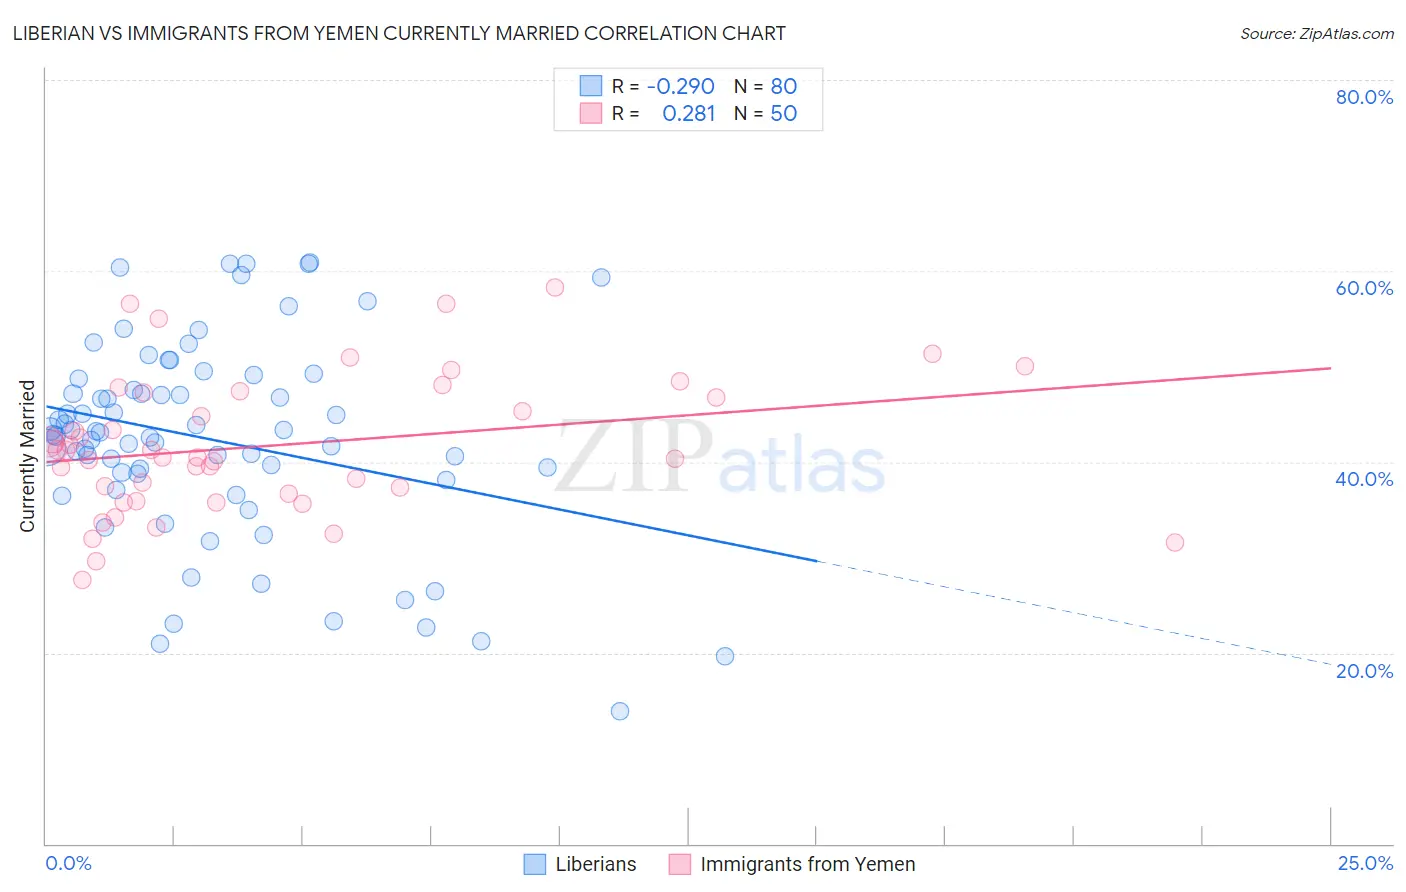
Liberian vs Immigrants from Yemen Currently Married Correlation Chart
The statistical analysis conducted on geographies consisting of 118,089,521 people shows a weak negative correlation between the proportion of Liberians and percentage of population currently married in the United States with a correlation coefficient (R) of -0.290 and weighted average of 42.2%. Similarly, the statistical analysis conducted on geographies consisting of 82,431,124 people shows a weak positive correlation between the proportion of Immigrants from Yemen and percentage of population currently married in the United States with a correlation coefficient (R) of 0.281 and weighted average of 42.1%, a difference of 0.34%.
Currently Married Correlation Summary
| Measurement | Liberian | Immigrants from Yemen |
| Minimum | 13.9% | 27.6% |
| Maximum | 60.9% | 58.2% |
| Range | 47.0% | 30.6% |
| Mean | 42.3% | 41.7% |
| Median | 42.9% | 40.8% |
| Interquartile 25% (IQ1) | 38.4% | 36.6% |
| Interquartile 75% (IQ3) | 48.1% | 47.3% |
| Interquartile Range (IQR) | 9.7% | 10.7% |
| Standard Deviation (Sample) | 10.5% | 7.2% |
| Standard Deviation (Population) | 10.4% | 7.1% |
Demographics Similar to Liberians and Immigrants from Yemen by Currently Married
In terms of currently married, the demographic groups most similar to Liberians are Immigrants from Honduras (42.2%, a difference of 0.030%), Belizean (42.2%, a difference of 0.10%), Cheyenne (42.2%, a difference of 0.12%), Menominee (42.3%, a difference of 0.23%), and Immigrants from Western Africa (42.4%, a difference of 0.44%). Similarly, the demographic groups most similar to Immigrants from Yemen are Belizean (42.2%, a difference of 0.24%), Immigrants from Zaire (42.0%, a difference of 0.25%), Sioux (41.9%, a difference of 0.26%), Immigrants from Honduras (42.2%, a difference of 0.37%), and Immigrants from Bahamas (41.9%, a difference of 0.37%).
| Demographics | Rating | Rank | Currently Married |
| Immigrants | Ghana | 0.0 /100 | #290 | Tragic 42.7% |
| Immigrants | Guatemala | 0.0 /100 | #291 | Tragic 42.6% |
| Sub-Saharan Africans | 0.0 /100 | #292 | Tragic 42.6% |
| Yuman | 0.0 /100 | #293 | Tragic 42.6% |
| Hondurans | 0.0 /100 | #294 | Tragic 42.5% |
| Immigrants | Western Africa | 0.0 /100 | #295 | Tragic 42.4% |
| Menominee | 0.0 /100 | #296 | Tragic 42.3% |
| Cheyenne | 0.0 /100 | #297 | Tragic 42.2% |
| Immigrants | Honduras | 0.0 /100 | #298 | Tragic 42.2% |
| Liberians | 0.0 /100 | #299 | Tragic 42.2% |
| Belizeans | 0.0 /100 | #300 | Tragic 42.2% |
| Immigrants | Yemen | 0.0 /100 | #301 | Tragic 42.1% |
| Immigrants | Zaire | 0.0 /100 | #302 | Tragic 42.0% |
| Sioux | 0.0 /100 | #303 | Tragic 41.9% |
| Immigrants | Bahamas | 0.0 /100 | #304 | Tragic 41.9% |
| Immigrants | Trinidad and Tobago | 0.0 /100 | #305 | Tragic 41.9% |
| Immigrants | Guyana | 0.0 /100 | #306 | Tragic 41.9% |
| Africans | 0.0 /100 | #307 | Tragic 41.8% |
| Immigrants | Belize | 0.0 /100 | #308 | Tragic 41.8% |
| Immigrants | Liberia | 0.0 /100 | #309 | Tragic 41.8% |
| Guyanese | 0.0 /100 | #310 | Tragic 41.6% |