Bahamian vs New Zealander Single Mother Households
COMPARE
Bahamian
New Zealander
Single Mother Households
Single Mother Households Comparison
Bahamians
New Zealanders
8.3%
SINGLE MOTHER HOUSEHOLDS
0.0/ 100
METRIC RATING
320th/ 347
METRIC RANK
5.6%
SINGLE MOTHER HOUSEHOLDS
98.2/ 100
METRIC RATING
76th/ 347
METRIC RANK
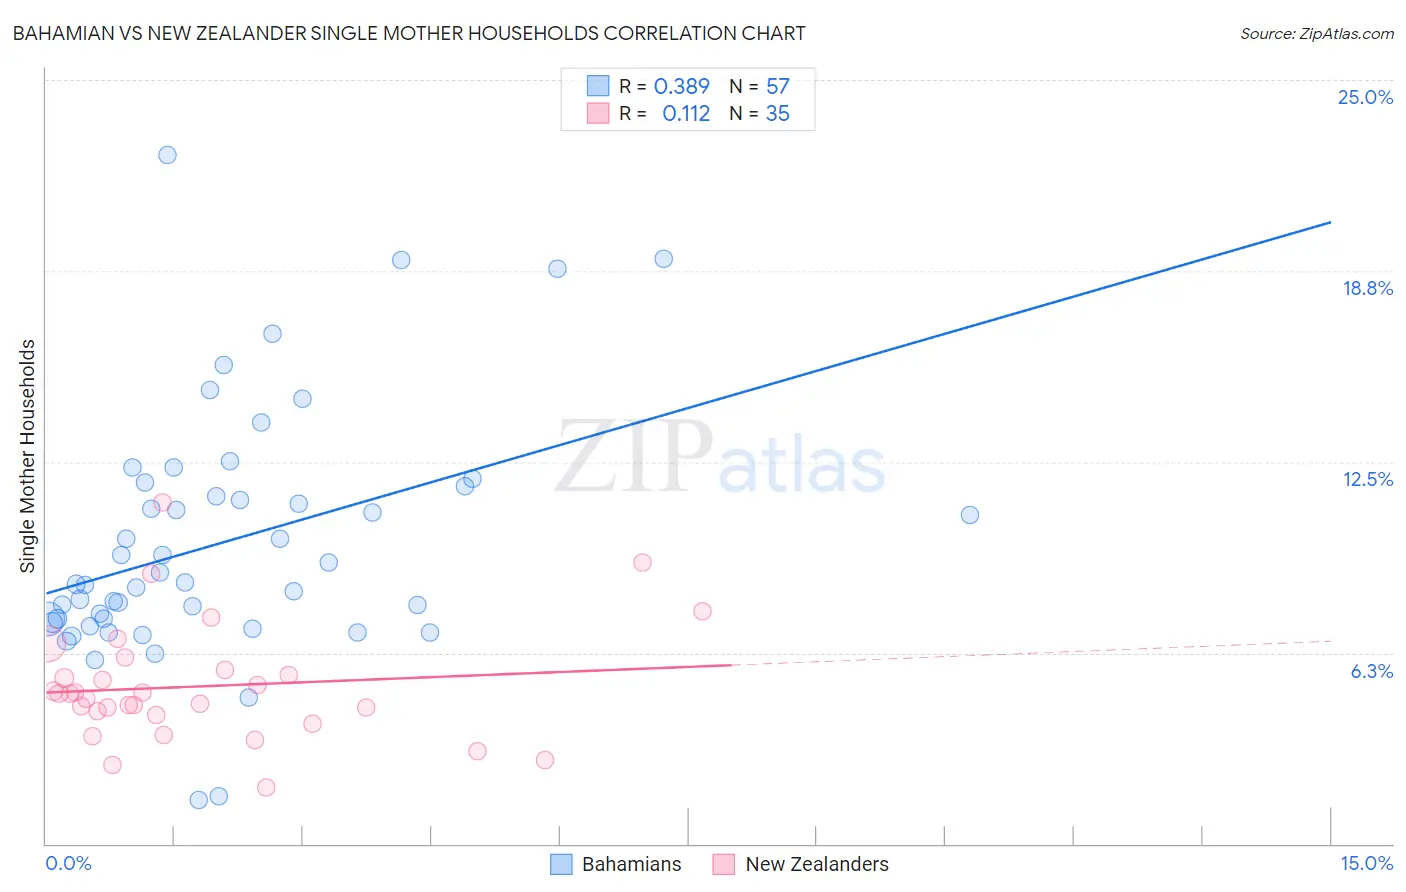
Bahamian vs New Zealander Single Mother Households Correlation Chart
The statistical analysis conducted on geographies consisting of 112,454,075 people shows a mild positive correlation between the proportion of Bahamians and percentage of single mother households in the United States with a correlation coefficient (R) of 0.389 and weighted average of 8.3%. Similarly, the statistical analysis conducted on geographies consisting of 106,839,899 people shows a poor positive correlation between the proportion of New Zealanders and percentage of single mother households in the United States with a correlation coefficient (R) of 0.112 and weighted average of 5.6%, a difference of 46.9%.
Single Mother Households Correlation Summary
| Measurement | Bahamian | New Zealander |
| Minimum | 1.4% | 1.8% |
| Maximum | 22.6% | 11.2% |
| Range | 21.1% | 9.3% |
| Mean | 9.9% | 5.2% |
| Median | 8.5% | 4.9% |
| Interquartile 25% (IQ1) | 7.3% | 4.2% |
| Interquartile 75% (IQ3) | 11.8% | 5.7% |
| Interquartile Range (IQR) | 4.5% | 1.5% |
| Standard Deviation (Sample) | 4.1% | 1.9% |
| Standard Deviation (Population) | 4.0% | 1.9% |
Similar Demographics by Single Mother Households
Demographics Similar to Bahamians by Single Mother Households
In terms of single mother households, the demographic groups most similar to Bahamians are Jamaican (8.2%, a difference of 0.12%), Senegalese (8.2%, a difference of 0.23%), Immigrants from Senegal (8.3%, a difference of 0.24%), Pima (8.3%, a difference of 0.32%), and Immigrants from Honduras (8.2%, a difference of 0.80%).
| Demographics | Rating | Rank | Single Mother Households |
| Immigrants | Grenada | 0.0 /100 | #313 | Tragic 8.2% |
| Immigrants | Mexico | 0.0 /100 | #314 | Tragic 8.2% |
| Immigrants | Western Africa | 0.0 /100 | #315 | Tragic 8.2% |
| Africans | 0.0 /100 | #316 | Tragic 8.2% |
| Immigrants | Honduras | 0.0 /100 | #317 | Tragic 8.2% |
| Senegalese | 0.0 /100 | #318 | Tragic 8.2% |
| Jamaicans | 0.0 /100 | #319 | Tragic 8.2% |
| Bahamians | 0.0 /100 | #320 | Tragic 8.3% |
| Immigrants | Senegal | 0.0 /100 | #321 | Tragic 8.3% |
| Pima | 0.0 /100 | #322 | Tragic 8.3% |
| Haitians | 0.0 /100 | #323 | Tragic 8.3% |
| Immigrants | Jamaica | 0.0 /100 | #324 | Tragic 8.4% |
| Immigrants | Caribbean | 0.0 /100 | #325 | Tragic 8.4% |
| British West Indians | 0.0 /100 | #326 | Tragic 8.4% |
| Immigrants | Haiti | 0.0 /100 | #327 | Tragic 8.4% |
Demographics Similar to New Zealanders by Single Mother Households
In terms of single mother households, the demographic groups most similar to New Zealanders are Slovene (5.6%, a difference of 0.070%), Romanian (5.6%, a difference of 0.19%), Swiss (5.6%, a difference of 0.19%), Immigrants from North America (5.6%, a difference of 0.21%), and Immigrants from Asia (5.6%, a difference of 0.24%).
| Demographics | Rating | Rank | Single Mother Households |
| Asians | 98.5 /100 | #69 | Exceptional 5.6% |
| Immigrants | Eastern Europe | 98.4 /100 | #70 | Exceptional 5.6% |
| Immigrants | Kazakhstan | 98.4 /100 | #71 | Exceptional 5.6% |
| Immigrants | Netherlands | 98.4 /100 | #72 | Exceptional 5.6% |
| Immigrants | Asia | 98.4 /100 | #73 | Exceptional 5.6% |
| Immigrants | North America | 98.3 /100 | #74 | Exceptional 5.6% |
| Slovenes | 98.3 /100 | #75 | Exceptional 5.6% |
| New Zealanders | 98.2 /100 | #76 | Exceptional 5.6% |
| Romanians | 98.1 /100 | #77 | Exceptional 5.6% |
| Swiss | 98.1 /100 | #78 | Exceptional 5.6% |
| Immigrants | Sri Lanka | 98.0 /100 | #79 | Exceptional 5.6% |
| Czechs | 97.9 /100 | #80 | Exceptional 5.6% |
| Immigrants | Moldova | 97.9 /100 | #81 | Exceptional 5.6% |
| Immigrants | Malaysia | 97.8 /100 | #82 | Exceptional 5.7% |
| Immigrants | Hungary | 97.8 /100 | #83 | Exceptional 5.7% |