Bahamian vs Immigrants from Argentina Single Mother Households
COMPARE
Bahamian
Immigrants from Argentina
Single Mother Households
Single Mother Households Comparison
Bahamians
Immigrants from Argentina
8.3%
SINGLE MOTHER HOUSEHOLDS
0.0/ 100
METRIC RATING
320th/ 347
METRIC RANK
5.9%
SINGLE MOTHER HOUSEHOLDS
93.2/ 100
METRIC RATING
124th/ 347
METRIC RANK
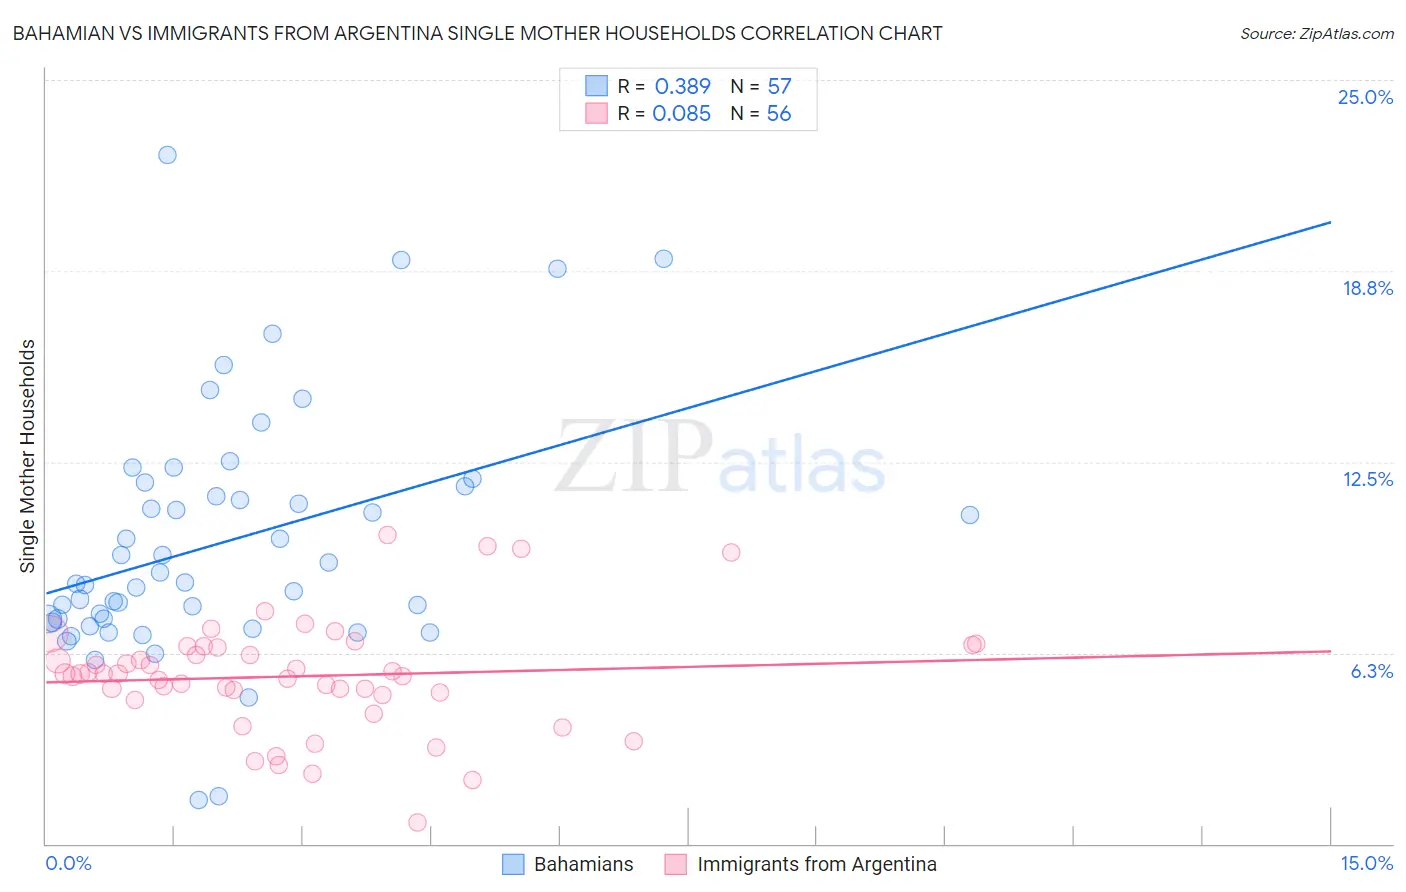
Bahamian vs Immigrants from Argentina Single Mother Households Correlation Chart
The statistical analysis conducted on geographies consisting of 112,454,075 people shows a mild positive correlation between the proportion of Bahamians and percentage of single mother households in the United States with a correlation coefficient (R) of 0.389 and weighted average of 8.3%. Similarly, the statistical analysis conducted on geographies consisting of 263,950,870 people shows a slight positive correlation between the proportion of Immigrants from Argentina and percentage of single mother households in the United States with a correlation coefficient (R) of 0.085 and weighted average of 5.9%, a difference of 40.9%.
Single Mother Households Correlation Summary
| Measurement | Bahamian | Immigrants from Argentina |
| Minimum | 1.4% | 0.70% |
| Maximum | 22.6% | 10.1% |
| Range | 21.1% | 9.4% |
| Mean | 9.9% | 5.5% |
| Median | 8.5% | 5.6% |
| Interquartile 25% (IQ1) | 7.3% | 4.9% |
| Interquartile 75% (IQ3) | 11.8% | 6.4% |
| Interquartile Range (IQR) | 4.5% | 1.5% |
| Standard Deviation (Sample) | 4.1% | 1.8% |
| Standard Deviation (Population) | 4.0% | 1.8% |
Similar Demographics by Single Mother Households
Demographics Similar to Bahamians by Single Mother Households
In terms of single mother households, the demographic groups most similar to Bahamians are Jamaican (8.2%, a difference of 0.12%), Senegalese (8.2%, a difference of 0.23%), Immigrants from Senegal (8.3%, a difference of 0.24%), Pima (8.3%, a difference of 0.32%), and Immigrants from Honduras (8.2%, a difference of 0.80%).
| Demographics | Rating | Rank | Single Mother Households |
| Immigrants | Grenada | 0.0 /100 | #313 | Tragic 8.2% |
| Immigrants | Mexico | 0.0 /100 | #314 | Tragic 8.2% |
| Immigrants | Western Africa | 0.0 /100 | #315 | Tragic 8.2% |
| Africans | 0.0 /100 | #316 | Tragic 8.2% |
| Immigrants | Honduras | 0.0 /100 | #317 | Tragic 8.2% |
| Senegalese | 0.0 /100 | #318 | Tragic 8.2% |
| Jamaicans | 0.0 /100 | #319 | Tragic 8.2% |
| Bahamians | 0.0 /100 | #320 | Tragic 8.3% |
| Immigrants | Senegal | 0.0 /100 | #321 | Tragic 8.3% |
| Pima | 0.0 /100 | #322 | Tragic 8.3% |
| Haitians | 0.0 /100 | #323 | Tragic 8.3% |
| Immigrants | Jamaica | 0.0 /100 | #324 | Tragic 8.4% |
| Immigrants | Caribbean | 0.0 /100 | #325 | Tragic 8.4% |
| British West Indians | 0.0 /100 | #326 | Tragic 8.4% |
| Immigrants | Haiti | 0.0 /100 | #327 | Tragic 8.4% |
Demographics Similar to Immigrants from Argentina by Single Mother Households
In terms of single mother households, the demographic groups most similar to Immigrants from Argentina are Immigrants from Uzbekistan (5.9%, a difference of 0.070%), Belgian (5.8%, a difference of 0.13%), Slavic (5.9%, a difference of 0.16%), Welsh (5.9%, a difference of 0.18%), and Argentinean (5.8%, a difference of 0.21%).
| Demographics | Rating | Rank | Single Mother Households |
| Bolivians | 94.6 /100 | #117 | Exceptional 5.8% |
| Laotians | 94.3 /100 | #118 | Exceptional 5.8% |
| South Africans | 94.1 /100 | #119 | Exceptional 5.8% |
| Tongans | 93.7 /100 | #120 | Exceptional 5.8% |
| Argentineans | 93.7 /100 | #121 | Exceptional 5.8% |
| Belgians | 93.5 /100 | #122 | Exceptional 5.8% |
| Immigrants | Uzbekistan | 93.4 /100 | #123 | Exceptional 5.9% |
| Immigrants | Argentina | 93.2 /100 | #124 | Exceptional 5.9% |
| Slavs | 92.9 /100 | #125 | Exceptional 5.9% |
| Welsh | 92.8 /100 | #126 | Exceptional 5.9% |
| Lebanese | 92.4 /100 | #127 | Exceptional 5.9% |
| Czechoslovakians | 92.2 /100 | #128 | Exceptional 5.9% |
| Immigrants | Bolivia | 92.2 /100 | #129 | Exceptional 5.9% |
| Palestinians | 92.1 /100 | #130 | Exceptional 5.9% |
| Immigrants | Spain | 91.2 /100 | #131 | Exceptional 5.9% |