Bahamian vs Immigrants from Philippines Single Mother Households
COMPARE
Bahamian
Immigrants from Philippines
Single Mother Households
Single Mother Households Comparison
Bahamians
Immigrants from Philippines
8.3%
SINGLE MOTHER HOUSEHOLDS
0.0/ 100
METRIC RATING
320th/ 347
METRIC RANK
6.1%
SINGLE MOTHER HOUSEHOLDS
78.5/ 100
METRIC RATING
154th/ 347
METRIC RANK
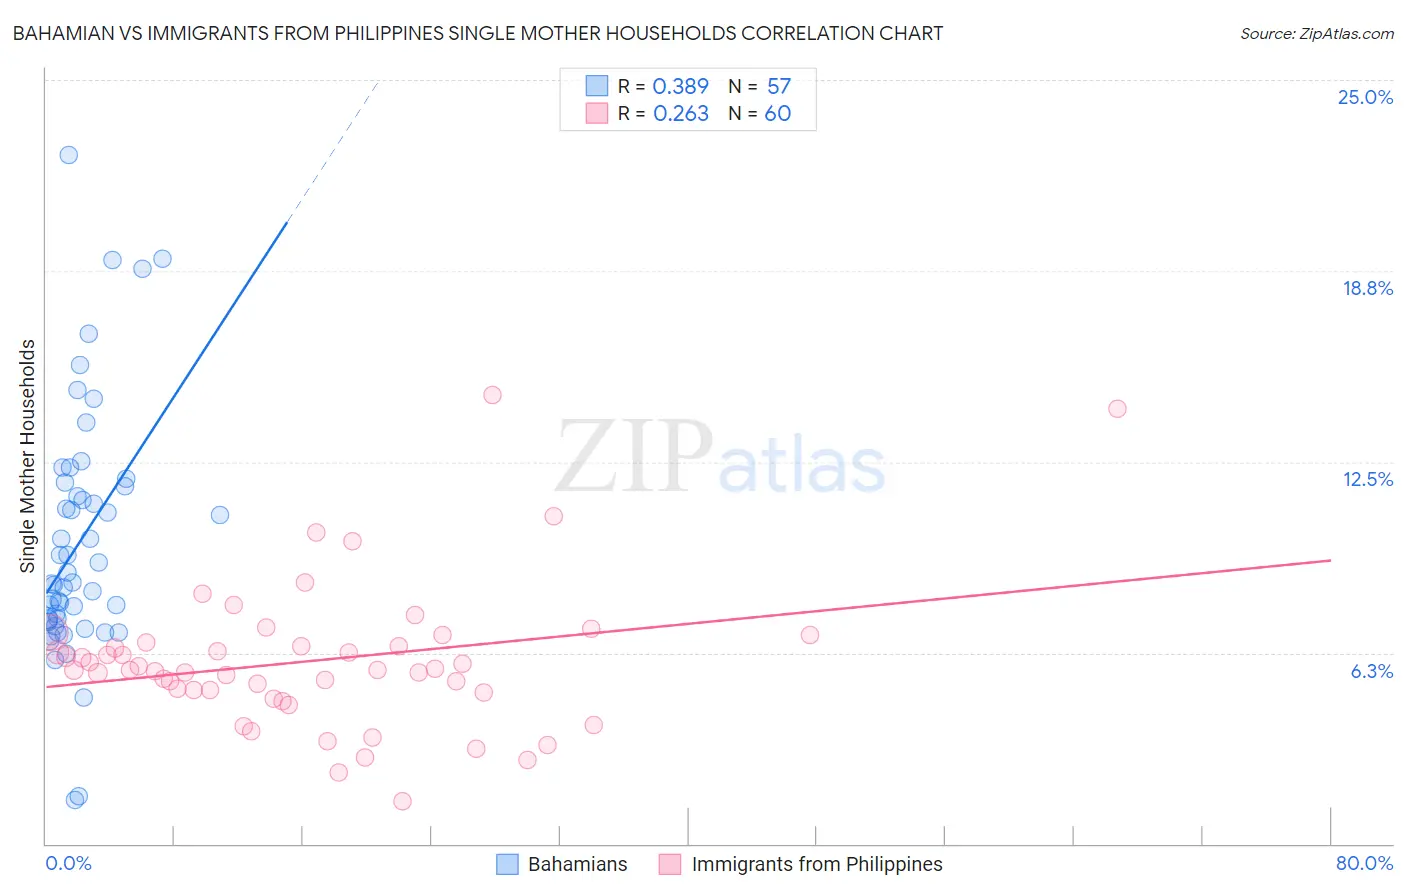
Bahamian vs Immigrants from Philippines Single Mother Households Correlation Chart
The statistical analysis conducted on geographies consisting of 112,454,075 people shows a mild positive correlation between the proportion of Bahamians and percentage of single mother households in the United States with a correlation coefficient (R) of 0.389 and weighted average of 8.3%. Similarly, the statistical analysis conducted on geographies consisting of 469,636,643 people shows a weak positive correlation between the proportion of Immigrants from Philippines and percentage of single mother households in the United States with a correlation coefficient (R) of 0.263 and weighted average of 6.1%, a difference of 35.6%.
Single Mother Households Correlation Summary
| Measurement | Bahamian | Immigrants from Philippines |
| Minimum | 1.4% | 1.4% |
| Maximum | 22.6% | 14.7% |
| Range | 21.1% | 13.3% |
| Mean | 9.9% | 6.0% |
| Median | 8.5% | 5.7% |
| Interquartile 25% (IQ1) | 7.3% | 5.0% |
| Interquartile 75% (IQ3) | 11.8% | 6.5% |
| Interquartile Range (IQR) | 4.5% | 1.5% |
| Standard Deviation (Sample) | 4.1% | 2.4% |
| Standard Deviation (Population) | 4.0% | 2.4% |
Similar Demographics by Single Mother Households
Demographics Similar to Bahamians by Single Mother Households
In terms of single mother households, the demographic groups most similar to Bahamians are Jamaican (8.2%, a difference of 0.12%), Senegalese (8.2%, a difference of 0.23%), Immigrants from Senegal (8.3%, a difference of 0.24%), Pima (8.3%, a difference of 0.32%), and Immigrants from Honduras (8.2%, a difference of 0.80%).
| Demographics | Rating | Rank | Single Mother Households |
| Immigrants | Grenada | 0.0 /100 | #313 | Tragic 8.2% |
| Immigrants | Mexico | 0.0 /100 | #314 | Tragic 8.2% |
| Immigrants | Western Africa | 0.0 /100 | #315 | Tragic 8.2% |
| Africans | 0.0 /100 | #316 | Tragic 8.2% |
| Immigrants | Honduras | 0.0 /100 | #317 | Tragic 8.2% |
| Senegalese | 0.0 /100 | #318 | Tragic 8.2% |
| Jamaicans | 0.0 /100 | #319 | Tragic 8.2% |
| Bahamians | 0.0 /100 | #320 | Tragic 8.3% |
| Immigrants | Senegal | 0.0 /100 | #321 | Tragic 8.3% |
| Pima | 0.0 /100 | #322 | Tragic 8.3% |
| Haitians | 0.0 /100 | #323 | Tragic 8.3% |
| Immigrants | Jamaica | 0.0 /100 | #324 | Tragic 8.4% |
| Immigrants | Caribbean | 0.0 /100 | #325 | Tragic 8.4% |
| British West Indians | 0.0 /100 | #326 | Tragic 8.4% |
| Immigrants | Haiti | 0.0 /100 | #327 | Tragic 8.4% |
Demographics Similar to Immigrants from Philippines by Single Mother Households
In terms of single mother households, the demographic groups most similar to Immigrants from Philippines are Immigrants from Brazil (6.1%, a difference of 0.070%), Pakistani (6.1%, a difference of 0.11%), White/Caucasian (6.1%, a difference of 0.33%), Immigrants from Southern Europe (6.1%, a difference of 0.34%), and Zimbabwean (6.1%, a difference of 0.39%).
| Demographics | Rating | Rank | Single Mother Households |
| Immigrants | Jordan | 82.3 /100 | #147 | Excellent 6.0% |
| Scotch-Irish | 82.0 /100 | #148 | Excellent 6.0% |
| Immigrants | Albania | 81.5 /100 | #149 | Excellent 6.1% |
| Zimbabweans | 80.7 /100 | #150 | Excellent 6.1% |
| Immigrants | Southern Europe | 80.5 /100 | #151 | Excellent 6.1% |
| Pakistanis | 79.2 /100 | #152 | Good 6.1% |
| Immigrants | Brazil | 78.9 /100 | #153 | Good 6.1% |
| Immigrants | Philippines | 78.5 /100 | #154 | Good 6.1% |
| Whites/Caucasians | 76.5 /100 | #155 | Good 6.1% |
| Native Hawaiians | 75.0 /100 | #156 | Good 6.1% |
| Chileans | 74.2 /100 | #157 | Good 6.1% |
| Celtics | 73.3 /100 | #158 | Good 6.1% |
| Yugoslavians | 73.1 /100 | #159 | Good 6.1% |
| Iraqis | 73.0 /100 | #160 | Good 6.1% |
| Immigrants | Germany | 72.4 /100 | #161 | Good 6.1% |