Slavic vs Comanche Single Mother Households
COMPARE
Slavic
Comanche
Single Mother Households
Single Mother Households Comparison
Slavs
Comanche
5.9%
SINGLE MOTHER HOUSEHOLDS
92.9/ 100
METRIC RATING
125th/ 347
METRIC RANK
7.0%
SINGLE MOTHER HOUSEHOLDS
1.5/ 100
METRIC RATING
232nd/ 347
METRIC RANK
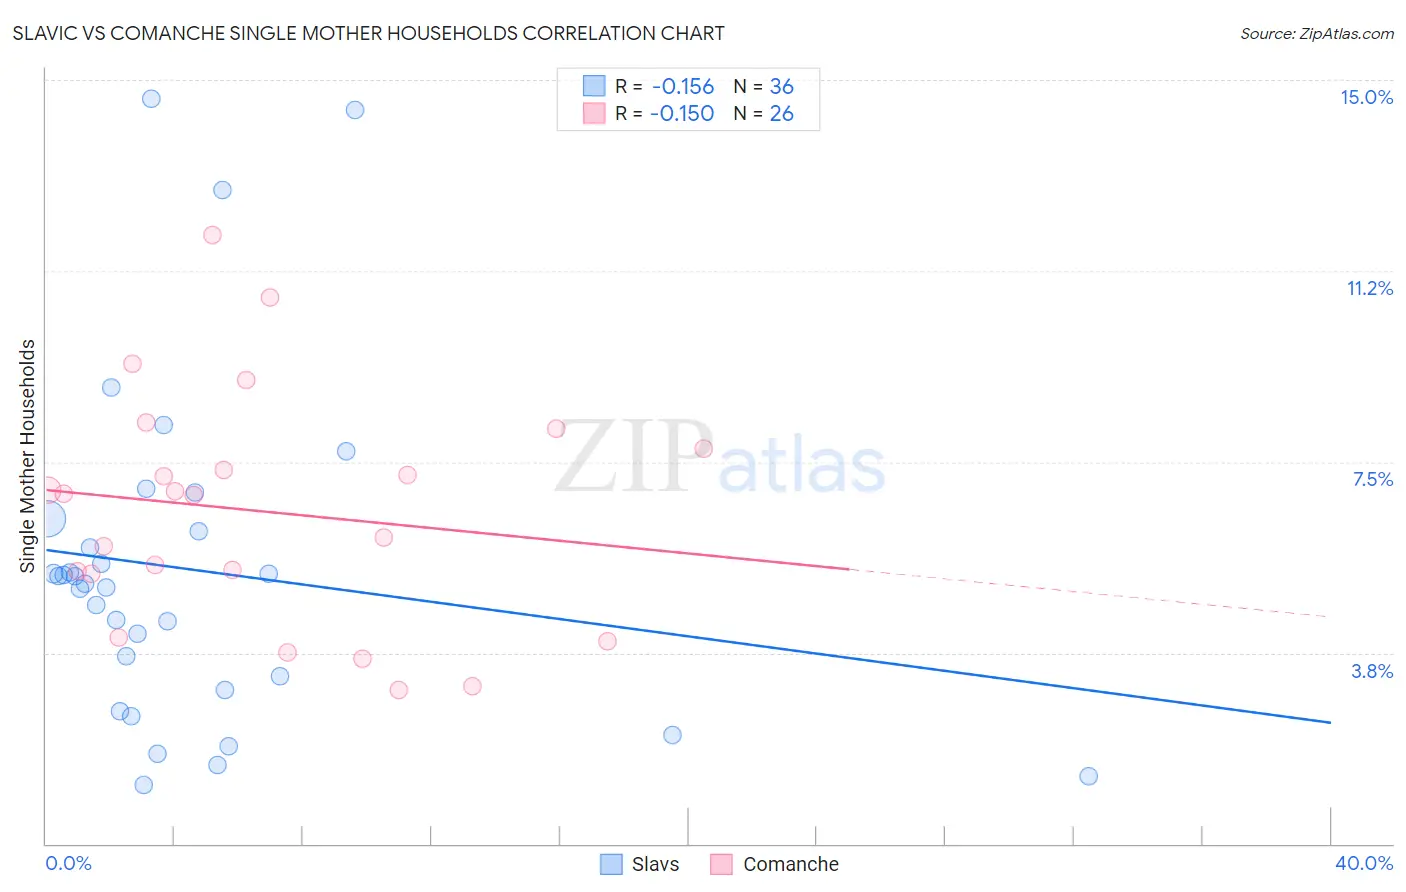
Slavic vs Comanche Single Mother Households Correlation Chart
The statistical analysis conducted on geographies consisting of 270,240,357 people shows a poor negative correlation between the proportion of Slavs and percentage of single mother households in the United States with a correlation coefficient (R) of -0.156 and weighted average of 5.9%. Similarly, the statistical analysis conducted on geographies consisting of 109,712,947 people shows a poor negative correlation between the proportion of Comanche and percentage of single mother households in the United States with a correlation coefficient (R) of -0.150 and weighted average of 7.0%, a difference of 19.8%.
Single Mother Households Correlation Summary
| Measurement | Slavic | Comanche |
| Minimum | 1.2% | 3.0% |
| Maximum | 14.6% | 11.9% |
| Range | 13.5% | 8.9% |
| Mean | 5.4% | 6.5% |
| Median | 5.2% | 6.9% |
| Interquartile 25% (IQ1) | 3.1% | 5.3% |
| Interquartile 75% (IQ3) | 6.3% | 7.8% |
| Interquartile Range (IQR) | 3.1% | 2.5% |
| Standard Deviation (Sample) | 3.3% | 2.3% |
| Standard Deviation (Population) | 3.2% | 2.2% |
Similar Demographics by Single Mother Households
Demographics Similar to Slavs by Single Mother Households
In terms of single mother households, the demographic groups most similar to Slavs are Welsh (5.9%, a difference of 0.020%), Immigrants from Argentina (5.9%, a difference of 0.16%), Lebanese (5.9%, a difference of 0.21%), Immigrants from Uzbekistan (5.9%, a difference of 0.23%), and Belgian (5.8%, a difference of 0.29%).
| Demographics | Rating | Rank | Single Mother Households |
| Laotians | 94.3 /100 | #118 | Exceptional 5.8% |
| South Africans | 94.1 /100 | #119 | Exceptional 5.8% |
| Tongans | 93.7 /100 | #120 | Exceptional 5.8% |
| Argentineans | 93.7 /100 | #121 | Exceptional 5.8% |
| Belgians | 93.5 /100 | #122 | Exceptional 5.8% |
| Immigrants | Uzbekistan | 93.4 /100 | #123 | Exceptional 5.9% |
| Immigrants | Argentina | 93.2 /100 | #124 | Exceptional 5.9% |
| Slavs | 92.9 /100 | #125 | Exceptional 5.9% |
| Welsh | 92.8 /100 | #126 | Exceptional 5.9% |
| Lebanese | 92.4 /100 | #127 | Exceptional 5.9% |
| Czechoslovakians | 92.2 /100 | #128 | Exceptional 5.9% |
| Immigrants | Bolivia | 92.2 /100 | #129 | Exceptional 5.9% |
| Palestinians | 92.1 /100 | #130 | Exceptional 5.9% |
| Immigrants | Spain | 91.2 /100 | #131 | Exceptional 5.9% |
| Albanians | 91.1 /100 | #132 | Exceptional 5.9% |
Demographics Similar to Comanche by Single Mother Households
In terms of single mother households, the demographic groups most similar to Comanche are Spanish American (7.0%, a difference of 0.060%), Creek (7.0%, a difference of 0.080%), Choctaw (7.0%, a difference of 0.17%), Chickasaw (7.0%, a difference of 0.19%), and Immigrants from Burma/Myanmar (7.0%, a difference of 0.26%).
| Demographics | Rating | Rank | Single Mother Households |
| Sudanese | 3.1 /100 | #225 | Tragic 6.9% |
| Paiute | 2.4 /100 | #226 | Tragic 7.0% |
| Kenyans | 2.3 /100 | #227 | Tragic 7.0% |
| Iroquois | 2.2 /100 | #228 | Tragic 7.0% |
| Immigrants | Kenya | 2.1 /100 | #229 | Tragic 7.0% |
| Creek | 1.6 /100 | #230 | Tragic 7.0% |
| Spanish Americans | 1.6 /100 | #231 | Tragic 7.0% |
| Comanche | 1.5 /100 | #232 | Tragic 7.0% |
| Choctaw | 1.4 /100 | #233 | Tragic 7.0% |
| Chickasaw | 1.4 /100 | #234 | Tragic 7.0% |
| Immigrants | Burma/Myanmar | 1.4 /100 | #235 | Tragic 7.0% |
| Ute | 1.0 /100 | #236 | Tragic 7.1% |
| Arapaho | 1.0 /100 | #237 | Tragic 7.1% |
| Panamanians | 0.9 /100 | #238 | Tragic 7.1% |
| Kiowa | 0.8 /100 | #239 | Tragic 7.1% |