Immigrants from Bulgaria vs Comanche Single Mother Households
COMPARE
Immigrants from Bulgaria
Comanche
Single Mother Households
Single Mother Households Comparison
Immigrants from Bulgaria
Comanche
5.6%
SINGLE MOTHER HOUSEHOLDS
98.5/ 100
METRIC RATING
68th/ 347
METRIC RANK
7.0%
SINGLE MOTHER HOUSEHOLDS
1.5/ 100
METRIC RATING
232nd/ 347
METRIC RANK
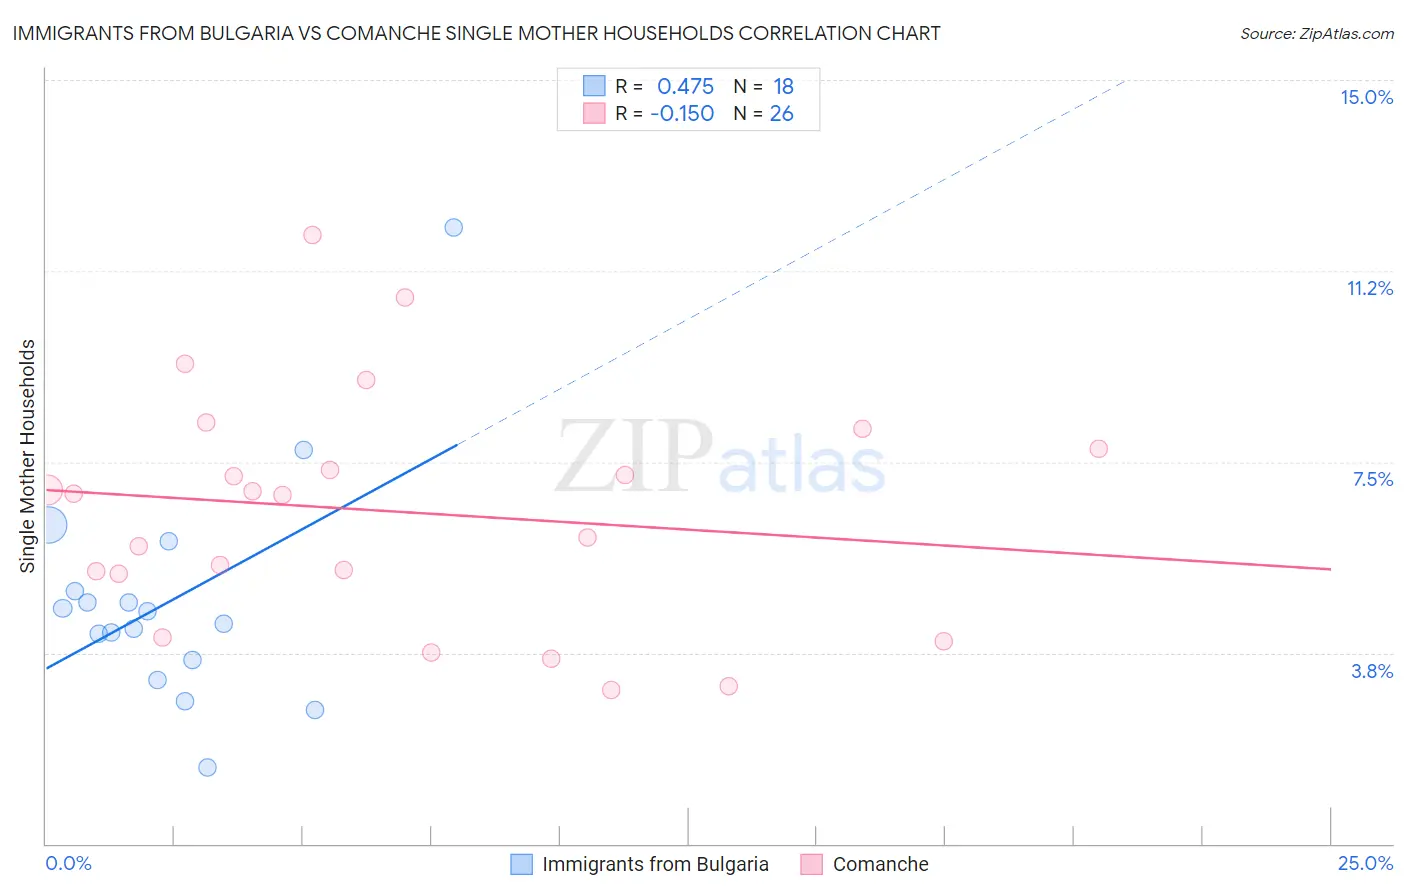
Immigrants from Bulgaria vs Comanche Single Mother Households Correlation Chart
The statistical analysis conducted on geographies consisting of 172,384,939 people shows a moderate positive correlation between the proportion of Immigrants from Bulgaria and percentage of single mother households in the United States with a correlation coefficient (R) of 0.475 and weighted average of 5.6%. Similarly, the statistical analysis conducted on geographies consisting of 109,712,947 people shows a poor negative correlation between the proportion of Comanche and percentage of single mother households in the United States with a correlation coefficient (R) of -0.150 and weighted average of 7.0%, a difference of 25.8%.
Single Mother Households Correlation Summary
| Measurement | Immigrants from Bulgaria | Comanche |
| Minimum | 1.5% | 3.0% |
| Maximum | 12.1% | 11.9% |
| Range | 10.6% | 8.9% |
| Mean | 4.8% | 6.5% |
| Median | 4.4% | 6.9% |
| Interquartile 25% (IQ1) | 3.6% | 5.3% |
| Interquartile 75% (IQ3) | 5.0% | 7.8% |
| Interquartile Range (IQR) | 1.3% | 2.5% |
| Standard Deviation (Sample) | 2.3% | 2.3% |
| Standard Deviation (Population) | 2.2% | 2.2% |
Similar Demographics by Single Mother Households
Demographics Similar to Immigrants from Bulgaria by Single Mother Households
In terms of single mother households, the demographic groups most similar to Immigrants from Bulgaria are Asian (5.6%, a difference of 0.020%), Italian (5.6%, a difference of 0.070%), Immigrants from Canada (5.6%, a difference of 0.080%), Immigrants from Eastern Europe (5.6%, a difference of 0.10%), and Immigrants from Kazakhstan (5.6%, a difference of 0.11%).
| Demographics | Rating | Rank | Single Mother Households |
| Australians | 98.7 /100 | #61 | Exceptional 5.6% |
| Poles | 98.6 /100 | #62 | Exceptional 5.6% |
| Immigrants | North Macedonia | 98.6 /100 | #63 | Exceptional 5.6% |
| Immigrants | France | 98.6 /100 | #64 | Exceptional 5.6% |
| Greeks | 98.6 /100 | #65 | Exceptional 5.6% |
| Immigrants | Canada | 98.5 /100 | #66 | Exceptional 5.6% |
| Italians | 98.5 /100 | #67 | Exceptional 5.6% |
| Immigrants | Bulgaria | 98.5 /100 | #68 | Exceptional 5.6% |
| Asians | 98.5 /100 | #69 | Exceptional 5.6% |
| Immigrants | Eastern Europe | 98.4 /100 | #70 | Exceptional 5.6% |
| Immigrants | Kazakhstan | 98.4 /100 | #71 | Exceptional 5.6% |
| Immigrants | Netherlands | 98.4 /100 | #72 | Exceptional 5.6% |
| Immigrants | Asia | 98.4 /100 | #73 | Exceptional 5.6% |
| Immigrants | North America | 98.3 /100 | #74 | Exceptional 5.6% |
| Slovenes | 98.3 /100 | #75 | Exceptional 5.6% |
Demographics Similar to Comanche by Single Mother Households
In terms of single mother households, the demographic groups most similar to Comanche are Spanish American (7.0%, a difference of 0.060%), Creek (7.0%, a difference of 0.080%), Choctaw (7.0%, a difference of 0.17%), Chickasaw (7.0%, a difference of 0.19%), and Immigrants from Burma/Myanmar (7.0%, a difference of 0.26%).
| Demographics | Rating | Rank | Single Mother Households |
| Sudanese | 3.1 /100 | #225 | Tragic 6.9% |
| Paiute | 2.4 /100 | #226 | Tragic 7.0% |
| Kenyans | 2.3 /100 | #227 | Tragic 7.0% |
| Iroquois | 2.2 /100 | #228 | Tragic 7.0% |
| Immigrants | Kenya | 2.1 /100 | #229 | Tragic 7.0% |
| Creek | 1.6 /100 | #230 | Tragic 7.0% |
| Spanish Americans | 1.6 /100 | #231 | Tragic 7.0% |
| Comanche | 1.5 /100 | #232 | Tragic 7.0% |
| Choctaw | 1.4 /100 | #233 | Tragic 7.0% |
| Chickasaw | 1.4 /100 | #234 | Tragic 7.0% |
| Immigrants | Burma/Myanmar | 1.4 /100 | #235 | Tragic 7.0% |
| Ute | 1.0 /100 | #236 | Tragic 7.1% |
| Arapaho | 1.0 /100 | #237 | Tragic 7.1% |
| Panamanians | 0.9 /100 | #238 | Tragic 7.1% |
| Kiowa | 0.8 /100 | #239 | Tragic 7.1% |