Bahamian vs Immigrants from Nigeria Single Mother Households
COMPARE
Bahamian
Immigrants from Nigeria
Single Mother Households
Single Mother Households Comparison
Bahamians
Immigrants from Nigeria
8.3%
SINGLE MOTHER HOUSEHOLDS
0.0/ 100
METRIC RATING
320th/ 347
METRIC RANK
7.8%
SINGLE MOTHER HOUSEHOLDS
0.0/ 100
METRIC RATING
290th/ 347
METRIC RANK
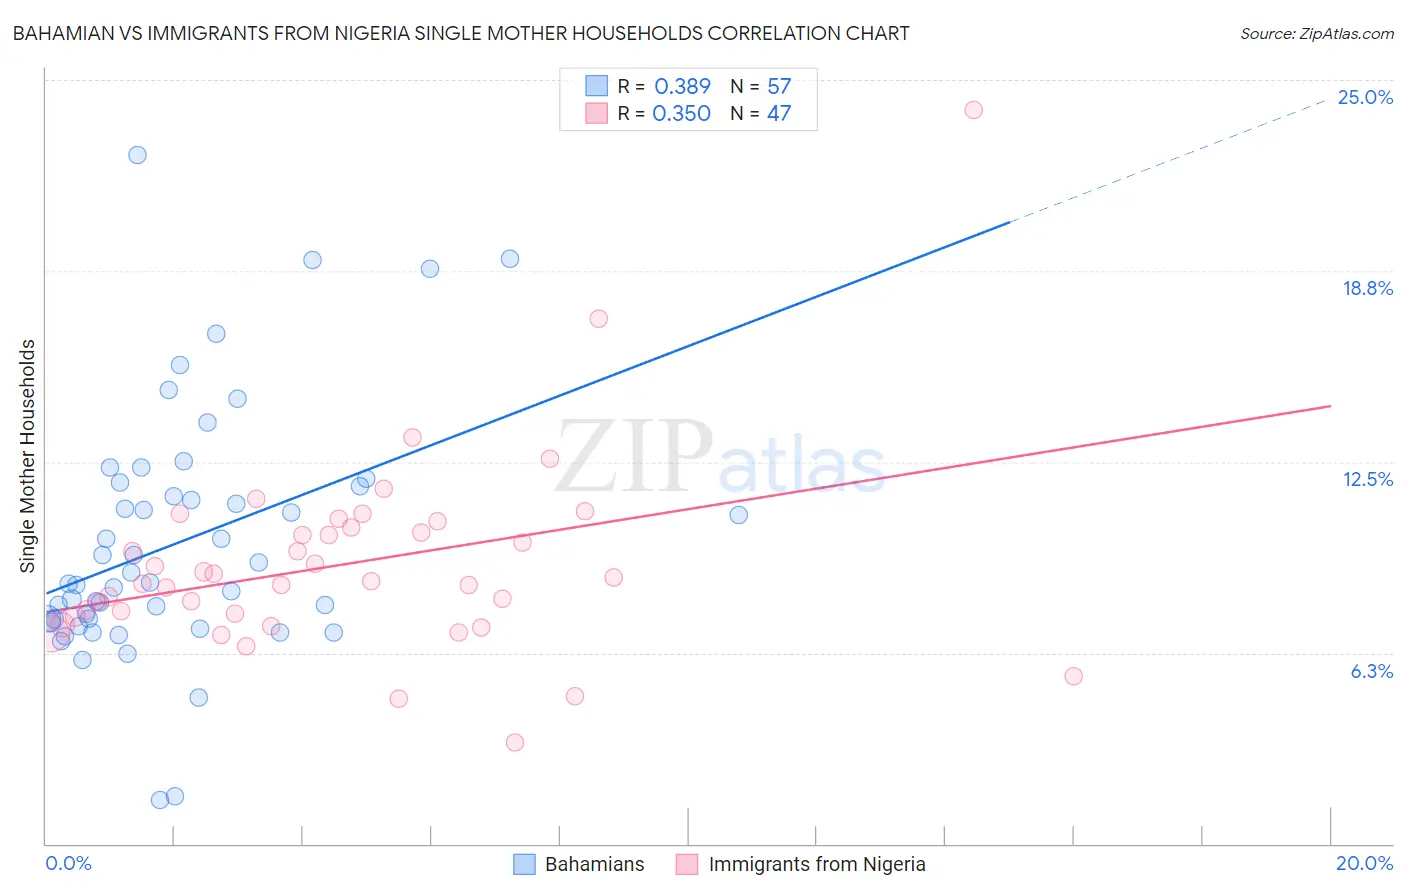
Bahamian vs Immigrants from Nigeria Single Mother Households Correlation Chart
The statistical analysis conducted on geographies consisting of 112,454,075 people shows a mild positive correlation between the proportion of Bahamians and percentage of single mother households in the United States with a correlation coefficient (R) of 0.389 and weighted average of 8.3%. Similarly, the statistical analysis conducted on geographies consisting of 283,117,346 people shows a mild positive correlation between the proportion of Immigrants from Nigeria and percentage of single mother households in the United States with a correlation coefficient (R) of 0.350 and weighted average of 7.8%, a difference of 5.3%.
Single Mother Households Correlation Summary
| Measurement | Bahamian | Immigrants from Nigeria |
| Minimum | 1.4% | 3.3% |
| Maximum | 22.6% | 24.0% |
| Range | 21.1% | 20.7% |
| Mean | 9.9% | 9.1% |
| Median | 8.5% | 8.6% |
| Interquartile 25% (IQ1) | 7.3% | 7.4% |
| Interquartile 75% (IQ3) | 11.8% | 10.4% |
| Interquartile Range (IQR) | 4.5% | 2.9% |
| Standard Deviation (Sample) | 4.1% | 3.2% |
| Standard Deviation (Population) | 4.0% | 3.2% |
Similar Demographics by Single Mother Households
Demographics Similar to Bahamians by Single Mother Households
In terms of single mother households, the demographic groups most similar to Bahamians are Jamaican (8.2%, a difference of 0.12%), Senegalese (8.2%, a difference of 0.23%), Immigrants from Senegal (8.3%, a difference of 0.24%), Pima (8.3%, a difference of 0.32%), and Immigrants from Honduras (8.2%, a difference of 0.80%).
| Demographics | Rating | Rank | Single Mother Households |
| Immigrants | Grenada | 0.0 /100 | #313 | Tragic 8.2% |
| Immigrants | Mexico | 0.0 /100 | #314 | Tragic 8.2% |
| Immigrants | Western Africa | 0.0 /100 | #315 | Tragic 8.2% |
| Africans | 0.0 /100 | #316 | Tragic 8.2% |
| Immigrants | Honduras | 0.0 /100 | #317 | Tragic 8.2% |
| Senegalese | 0.0 /100 | #318 | Tragic 8.2% |
| Jamaicans | 0.0 /100 | #319 | Tragic 8.2% |
| Bahamians | 0.0 /100 | #320 | Tragic 8.3% |
| Immigrants | Senegal | 0.0 /100 | #321 | Tragic 8.3% |
| Pima | 0.0 /100 | #322 | Tragic 8.3% |
| Haitians | 0.0 /100 | #323 | Tragic 8.3% |
| Immigrants | Jamaica | 0.0 /100 | #324 | Tragic 8.4% |
| Immigrants | Caribbean | 0.0 /100 | #325 | Tragic 8.4% |
| British West Indians | 0.0 /100 | #326 | Tragic 8.4% |
| Immigrants | Haiti | 0.0 /100 | #327 | Tragic 8.4% |
Demographics Similar to Immigrants from Nigeria by Single Mother Households
In terms of single mother households, the demographic groups most similar to Immigrants from Nigeria are West Indian (7.8%, a difference of 0.080%), Ghanaian (7.8%, a difference of 0.090%), Subsaharan African (7.8%, a difference of 0.42%), Immigrants from Cameroon (7.9%, a difference of 0.45%), and Apache (7.9%, a difference of 0.55%).
| Demographics | Rating | Rank | Single Mother Households |
| Nigerians | 0.0 /100 | #283 | Tragic 7.7% |
| Immigrants | Belize | 0.0 /100 | #284 | Tragic 7.7% |
| Trinidadians and Tobagonians | 0.0 /100 | #285 | Tragic 7.7% |
| Immigrants | Middle Africa | 0.0 /100 | #286 | Tragic 7.7% |
| Immigrants | Guatemala | 0.0 /100 | #287 | Tragic 7.7% |
| Sierra Leoneans | 0.0 /100 | #288 | Tragic 7.7% |
| Sub-Saharan Africans | 0.0 /100 | #289 | Tragic 7.8% |
| Immigrants | Nigeria | 0.0 /100 | #290 | Tragic 7.8% |
| West Indians | 0.0 /100 | #291 | Tragic 7.8% |
| Ghanaians | 0.0 /100 | #292 | Tragic 7.8% |
| Immigrants | Cameroon | 0.0 /100 | #293 | Tragic 7.9% |
| Apache | 0.0 /100 | #294 | Tragic 7.9% |
| Barbadians | 0.0 /100 | #295 | Tragic 7.9% |
| Immigrants | Latin America | 0.0 /100 | #296 | Tragic 7.9% |
| Hispanics or Latinos | 0.0 /100 | #297 | Tragic 7.9% |