Native/Alaskan vs Comanche Single Mother Households
COMPARE
Native/Alaskan
Comanche
Single Mother Households
Single Mother Households Comparison
Natives/Alaskans
Comanche
8.0%
SINGLE MOTHER HOUSEHOLDS
0.0/ 100
METRIC RATING
304th/ 347
METRIC RANK
7.0%
SINGLE MOTHER HOUSEHOLDS
1.5/ 100
METRIC RATING
232nd/ 347
METRIC RANK
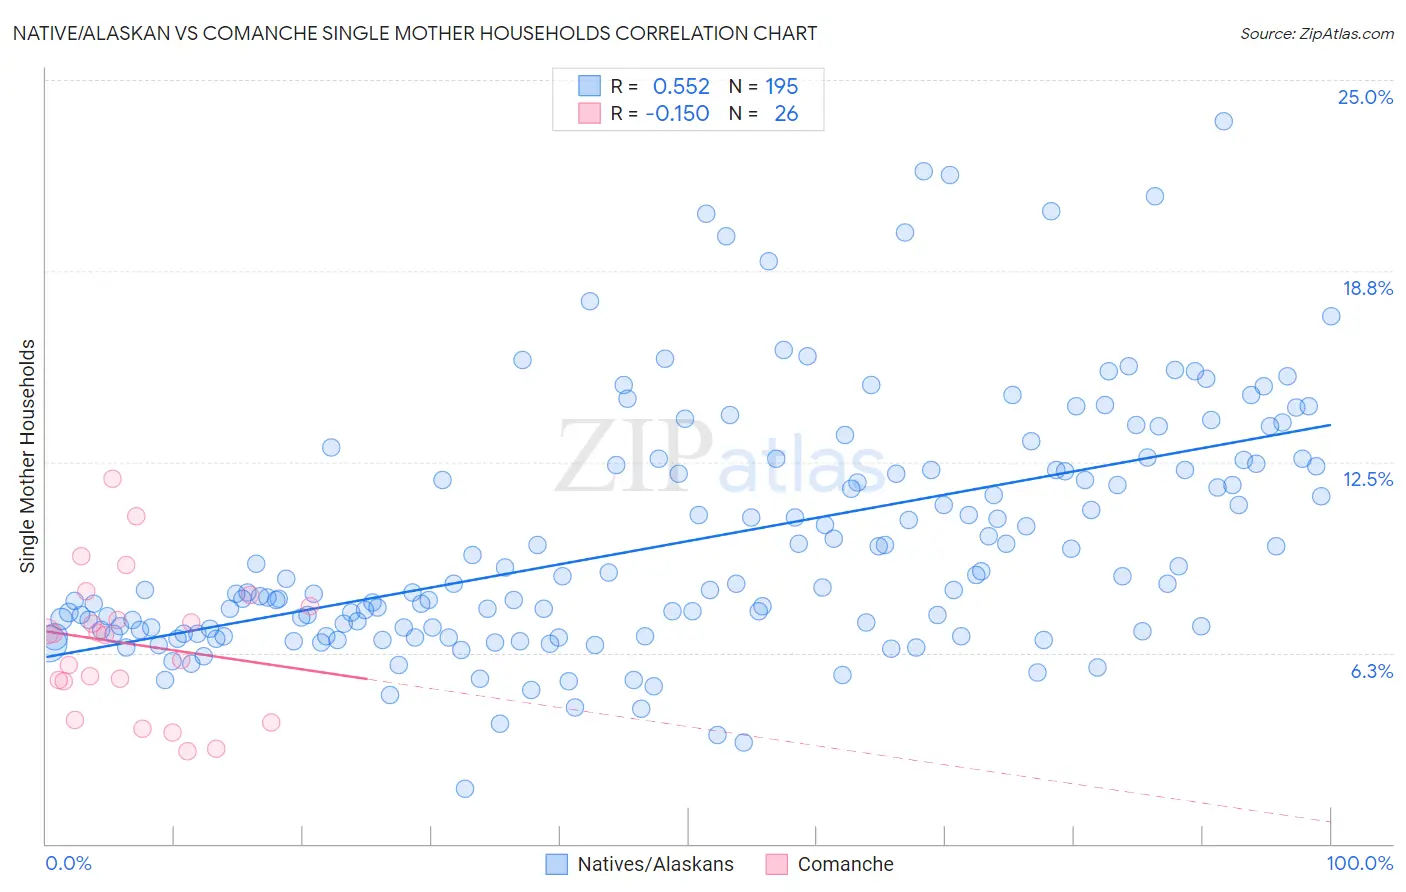
Native/Alaskan vs Comanche Single Mother Households Correlation Chart
The statistical analysis conducted on geographies consisting of 510,596,383 people shows a substantial positive correlation between the proportion of Natives/Alaskans and percentage of single mother households in the United States with a correlation coefficient (R) of 0.552 and weighted average of 8.0%. Similarly, the statistical analysis conducted on geographies consisting of 109,712,947 people shows a poor negative correlation between the proportion of Comanche and percentage of single mother households in the United States with a correlation coefficient (R) of -0.150 and weighted average of 7.0%, a difference of 14.1%.
Single Mother Households Correlation Summary
| Measurement | Native/Alaskan | Comanche |
| Minimum | 1.8% | 3.0% |
| Maximum | 23.6% | 11.9% |
| Range | 21.8% | 8.9% |
| Mean | 9.9% | 6.5% |
| Median | 8.4% | 6.9% |
| Interquartile 25% (IQ1) | 7.0% | 5.3% |
| Interquartile 75% (IQ3) | 12.4% | 7.8% |
| Interquartile Range (IQR) | 5.4% | 2.5% |
| Standard Deviation (Sample) | 4.0% | 2.3% |
| Standard Deviation (Population) | 4.0% | 2.2% |
Similar Demographics by Single Mother Households
Demographics Similar to Natives/Alaskans by Single Mother Households
In terms of single mother households, the demographic groups most similar to Natives/Alaskans are Colville (8.0%, a difference of 0.050%), Immigrants from Barbados (8.0%, a difference of 0.12%), Immigrants from St. Vincent and the Grenadines (8.0%, a difference of 0.36%), Immigrants from Central America (8.1%, a difference of 0.38%), and Immigrants from Bahamas (8.0%, a difference of 0.44%).
| Demographics | Rating | Rank | Single Mother Households |
| Hispanics or Latinos | 0.0 /100 | #297 | Tragic 7.9% |
| Immigrants | West Indies | 0.0 /100 | #298 | Tragic 7.9% |
| Houma | 0.0 /100 | #299 | Tragic 7.9% |
| Mexicans | 0.0 /100 | #300 | Tragic 8.0% |
| Chippewa | 0.0 /100 | #301 | Tragic 8.0% |
| Immigrants | Ghana | 0.0 /100 | #302 | Tragic 8.0% |
| Immigrants | Bahamas | 0.0 /100 | #303 | Tragic 8.0% |
| Natives/Alaskans | 0.0 /100 | #304 | Tragic 8.0% |
| Colville | 0.0 /100 | #305 | Tragic 8.0% |
| Immigrants | Barbados | 0.0 /100 | #306 | Tragic 8.0% |
| Immigrants | St. Vincent and the Grenadines | 0.0 /100 | #307 | Tragic 8.0% |
| Immigrants | Central America | 0.0 /100 | #308 | Tragic 8.1% |
| Cheyenne | 0.0 /100 | #309 | Tragic 8.1% |
| Hondurans | 0.0 /100 | #310 | Tragic 8.1% |
| Immigrants | Congo | 0.0 /100 | #311 | Tragic 8.1% |
Demographics Similar to Comanche by Single Mother Households
In terms of single mother households, the demographic groups most similar to Comanche are Spanish American (7.0%, a difference of 0.060%), Creek (7.0%, a difference of 0.080%), Choctaw (7.0%, a difference of 0.17%), Chickasaw (7.0%, a difference of 0.19%), and Immigrants from Burma/Myanmar (7.0%, a difference of 0.26%).
| Demographics | Rating | Rank | Single Mother Households |
| Sudanese | 3.1 /100 | #225 | Tragic 6.9% |
| Paiute | 2.4 /100 | #226 | Tragic 7.0% |
| Kenyans | 2.3 /100 | #227 | Tragic 7.0% |
| Iroquois | 2.2 /100 | #228 | Tragic 7.0% |
| Immigrants | Kenya | 2.1 /100 | #229 | Tragic 7.0% |
| Creek | 1.6 /100 | #230 | Tragic 7.0% |
| Spanish Americans | 1.6 /100 | #231 | Tragic 7.0% |
| Comanche | 1.5 /100 | #232 | Tragic 7.0% |
| Choctaw | 1.4 /100 | #233 | Tragic 7.0% |
| Chickasaw | 1.4 /100 | #234 | Tragic 7.0% |
| Immigrants | Burma/Myanmar | 1.4 /100 | #235 | Tragic 7.0% |
| Ute | 1.0 /100 | #236 | Tragic 7.1% |
| Arapaho | 1.0 /100 | #237 | Tragic 7.1% |
| Panamanians | 0.9 /100 | #238 | Tragic 7.1% |
| Kiowa | 0.8 /100 | #239 | Tragic 7.1% |