Brazilian vs Lumbee Average Family Size
COMPARE
Brazilian
Lumbee
Average Family Size
Average Family Size Comparison
Brazilians
Lumbee
3.18
AVERAGE FAMILY SIZE
4.5/ 100
METRIC RATING
233rd/ 347
METRIC RANK
3.32
AVERAGE FAMILY SIZE
99.8/ 100
METRIC RATING
80th/ 347
METRIC RANK
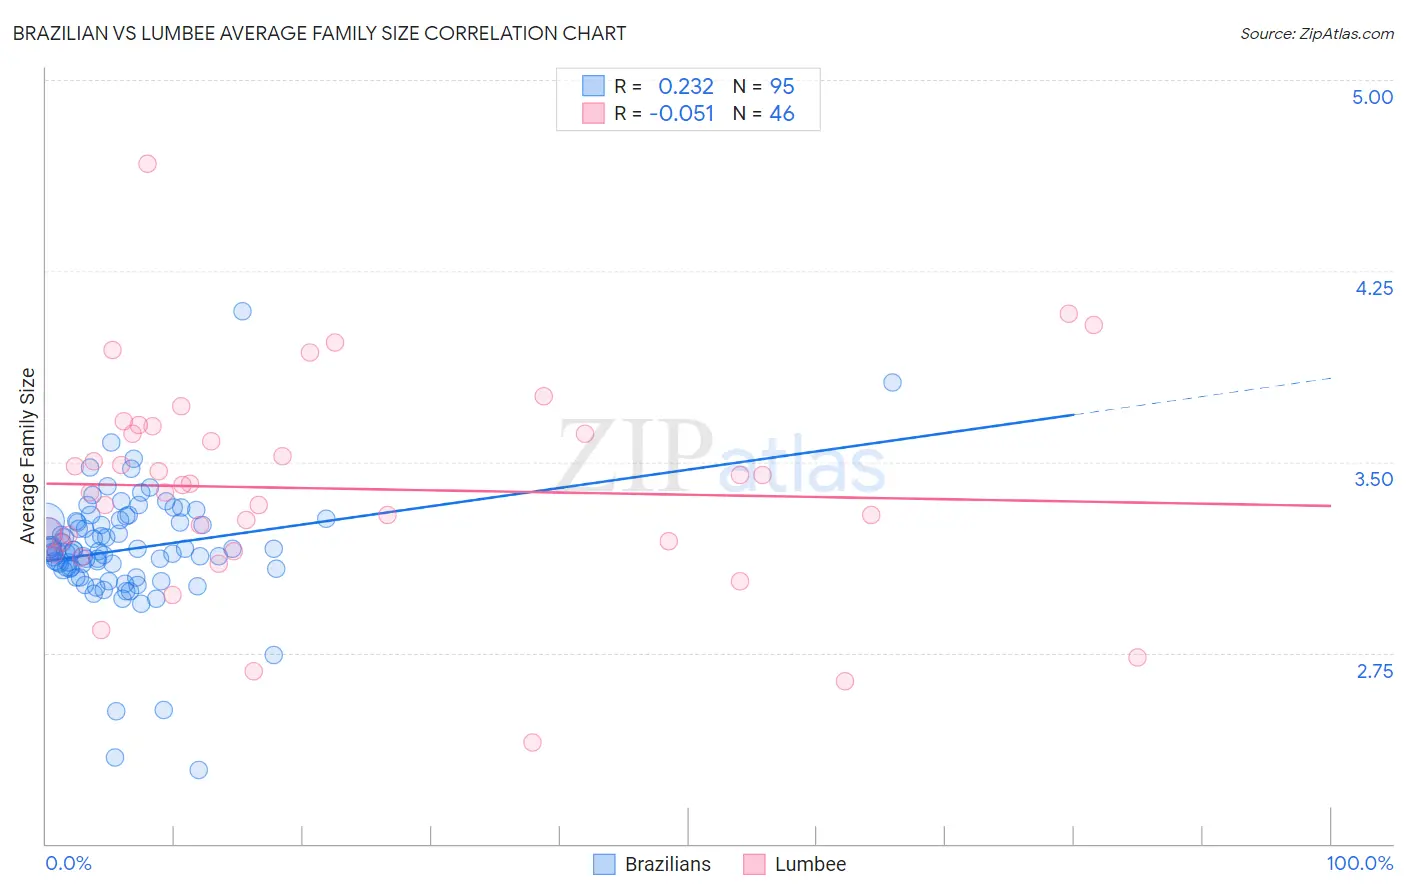
Brazilian vs Lumbee Average Family Size Correlation Chart
The statistical analysis conducted on geographies consisting of 323,732,012 people shows a weak positive correlation between the proportion of Brazilians and average family size in the United States with a correlation coefficient (R) of 0.232 and weighted average of 3.18. Similarly, the statistical analysis conducted on geographies consisting of 92,265,029 people shows a slight negative correlation between the proportion of Lumbee and average family size in the United States with a correlation coefficient (R) of -0.051 and weighted average of 3.32, a difference of 4.3%.
Average Family Size Correlation Summary
| Measurement | Brazilian | Lumbee |
| Minimum | 2.29 | 2.40 |
| Maximum | 4.09 | 4.67 |
| Range | 1.80 | 2.27 |
| Mean | 3.16 | 3.40 |
| Median | 3.15 | 3.40 |
| Interquartile 25% (IQ1) | 3.08 | 3.19 |
| Interquartile 75% (IQ3) | 3.26 | 3.61 |
| Interquartile Range (IQR) | 0.19 | 0.42 |
| Standard Deviation (Sample) | 0.24 | 0.41 |
| Standard Deviation (Population) | 0.24 | 0.41 |
Similar Demographics by Average Family Size
Demographics Similar to Brazilians by Average Family Size
In terms of average family size, the demographic groups most similar to Brazilians are Iranian (3.18, a difference of 0.0%), Cherokee (3.18, a difference of 0.020%), Immigrants from Turkey (3.18, a difference of 0.030%), Immigrants from Portugal (3.18, a difference of 0.040%), and Icelander (3.19, a difference of 0.070%).
| Demographics | Rating | Rank | Average Family Size |
| Chickasaw | 6.0 /100 | #226 | Tragic 3.19 |
| Portuguese | 6.0 /100 | #227 | Tragic 3.19 |
| Immigrants | Nonimmigrants | 5.7 /100 | #228 | Tragic 3.19 |
| Immigrants | Italy | 5.3 /100 | #229 | Tragic 3.19 |
| Icelanders | 5.2 /100 | #230 | Tragic 3.19 |
| Basques | 5.2 /100 | #231 | Tragic 3.19 |
| Cherokee | 4.7 /100 | #232 | Tragic 3.18 |
| Brazilians | 4.5 /100 | #233 | Tragic 3.18 |
| Iranians | 4.5 /100 | #234 | Tragic 3.18 |
| Immigrants | Turkey | 4.2 /100 | #235 | Tragic 3.18 |
| Immigrants | Portugal | 4.2 /100 | #236 | Tragic 3.18 |
| Immigrants | Romania | 3.7 /100 | #237 | Tragic 3.18 |
| Romanians | 3.7 /100 | #238 | Tragic 3.18 |
| Houma | 3.4 /100 | #239 | Tragic 3.18 |
| Osage | 3.2 /100 | #240 | Tragic 3.18 |
Demographics Similar to Lumbee by Average Family Size
In terms of average family size, the demographic groups most similar to Lumbee are British West Indian (3.32, a difference of 0.020%), Immigrants from Micronesia (3.32, a difference of 0.030%), Immigrants from Dominica (3.32, a difference of 0.040%), Immigrants from Ecuador (3.32, a difference of 0.070%), and Trinidadian and Tobagonian (3.32, a difference of 0.080%).
| Demographics | Rating | Rank | Average Family Size |
| Yaqui | 99.9 /100 | #73 | Exceptional 3.32 |
| Immigrants | Sierra Leone | 99.9 /100 | #74 | Exceptional 3.32 |
| Immigrants | Barbados | 99.8 /100 | #75 | Exceptional 3.32 |
| Trinidadians and Tobagonians | 99.8 /100 | #76 | Exceptional 3.32 |
| Immigrants | Ecuador | 99.8 /100 | #77 | Exceptional 3.32 |
| Immigrants | Micronesia | 99.8 /100 | #78 | Exceptional 3.32 |
| British West Indians | 99.8 /100 | #79 | Exceptional 3.32 |
| Lumbee | 99.8 /100 | #80 | Exceptional 3.32 |
| Immigrants | Dominica | 99.8 /100 | #81 | Exceptional 3.32 |
| Ecuadorians | 99.8 /100 | #82 | Exceptional 3.32 |
| Immigrants | Afghanistan | 99.8 /100 | #83 | Exceptional 3.32 |
| Immigrants | Nigeria | 99.7 /100 | #84 | Exceptional 3.32 |
| Afghans | 99.7 /100 | #85 | Exceptional 3.31 |
| Jamaicans | 99.7 /100 | #86 | Exceptional 3.31 |
| Immigrants | Peru | 99.7 /100 | #87 | Exceptional 3.31 |