Immigrants from Oceania vs Lumbee Average Family Size
COMPARE
Immigrants from Oceania
Lumbee
Average Family Size
Average Family Size Comparison
Immigrants from Oceania
Lumbee
3.29
AVERAGE FAMILY SIZE
98.7/ 100
METRIC RATING
97th/ 347
METRIC RANK
3.32
AVERAGE FAMILY SIZE
99.8/ 100
METRIC RATING
80th/ 347
METRIC RANK
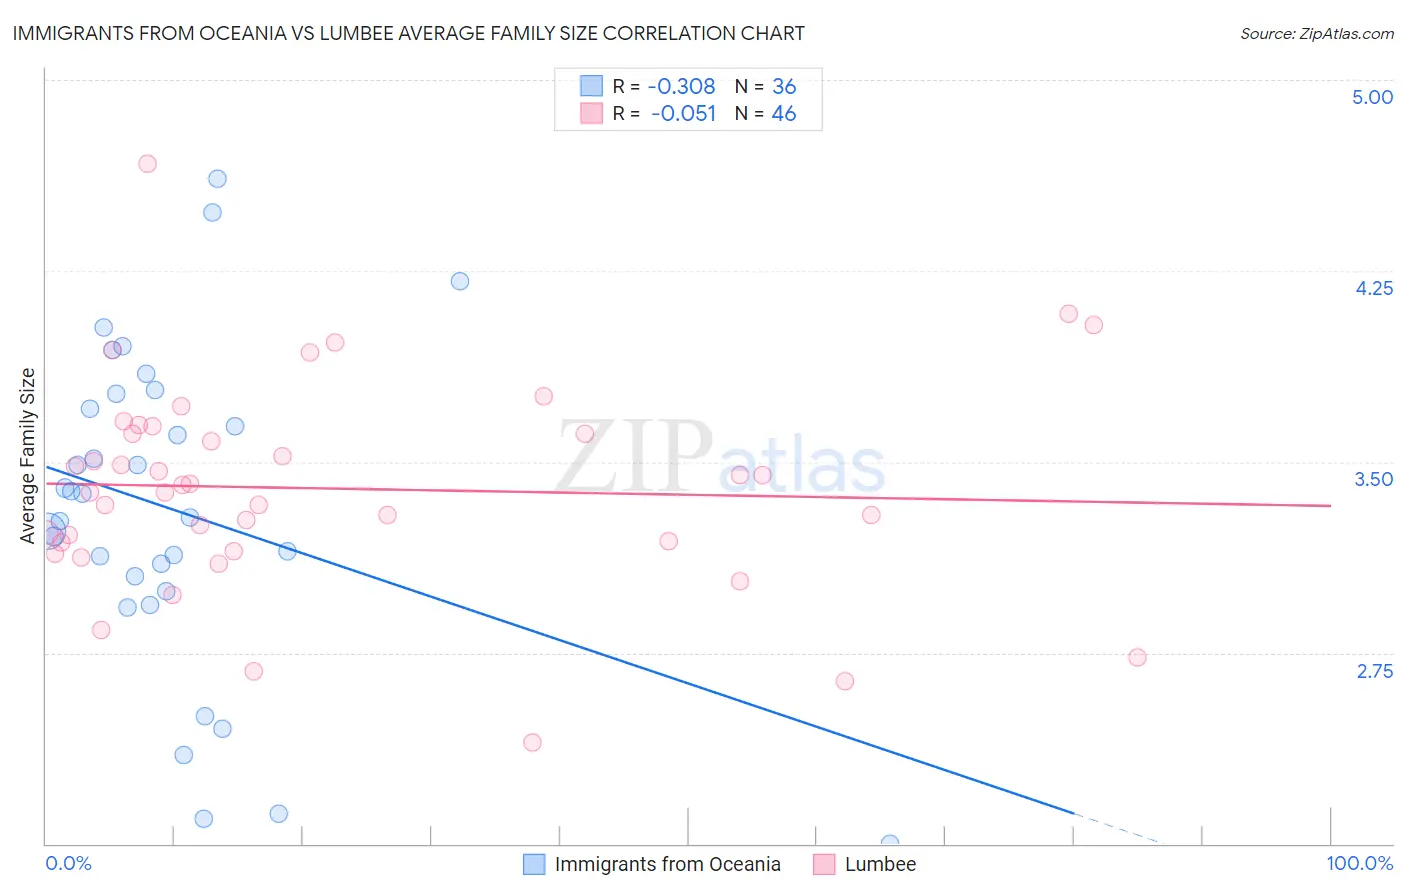
Immigrants from Oceania vs Lumbee Average Family Size Correlation Chart
The statistical analysis conducted on geographies consisting of 305,389,085 people shows a mild negative correlation between the proportion of Immigrants from Oceania and average family size in the United States with a correlation coefficient (R) of -0.308 and weighted average of 3.29. Similarly, the statistical analysis conducted on geographies consisting of 92,265,029 people shows a slight negative correlation between the proportion of Lumbee and average family size in the United States with a correlation coefficient (R) of -0.051 and weighted average of 3.32, a difference of 0.85%.
Average Family Size Correlation Summary
| Measurement | Immigrants from Oceania | Lumbee |
| Minimum | 2.00 | 2.40 |
| Maximum | 4.61 | 4.67 |
| Range | 2.61 | 2.27 |
| Mean | 3.31 | 3.40 |
| Median | 3.33 | 3.40 |
| Interquartile 25% (IQ1) | 3.02 | 3.19 |
| Interquartile 75% (IQ3) | 3.74 | 3.61 |
| Interquartile Range (IQR) | 0.71 | 0.42 |
| Standard Deviation (Sample) | 0.63 | 0.41 |
| Standard Deviation (Population) | 0.62 | 0.41 |
Demographics Similar to Immigrants from Oceania and Lumbee by Average Family Size
In terms of average family size, the demographic groups most similar to Immigrants from Oceania are Barbadian (3.29, a difference of 0.0%), U.S. Virgin Islander (3.29, a difference of 0.040%), Immigrants from Lebanon (3.30, a difference of 0.12%), Sierra Leonean (3.30, a difference of 0.13%), and Peruvian (3.30, a difference of 0.23%). Similarly, the demographic groups most similar to Lumbee are British West Indian (3.32, a difference of 0.020%), Immigrants from Micronesia (3.32, a difference of 0.030%), Immigrants from Dominica (3.32, a difference of 0.040%), Ecuadorian (3.32, a difference of 0.080%), and Immigrants from Afghanistan (3.32, a difference of 0.090%).
| Demographics | Rating | Rank | Average Family Size |
| Immigrants | Micronesia | 99.8 /100 | #78 | Exceptional 3.32 |
| British West Indians | 99.8 /100 | #79 | Exceptional 3.32 |
| Lumbee | 99.8 /100 | #80 | Exceptional 3.32 |
| Immigrants | Dominica | 99.8 /100 | #81 | Exceptional 3.32 |
| Ecuadorians | 99.8 /100 | #82 | Exceptional 3.32 |
| Immigrants | Afghanistan | 99.8 /100 | #83 | Exceptional 3.32 |
| Immigrants | Nigeria | 99.7 /100 | #84 | Exceptional 3.32 |
| Afghans | 99.7 /100 | #85 | Exceptional 3.31 |
| Jamaicans | 99.7 /100 | #86 | Exceptional 3.31 |
| Immigrants | Peru | 99.7 /100 | #87 | Exceptional 3.31 |
| Immigrants | Bolivia | 99.6 /100 | #88 | Exceptional 3.31 |
| Malaysians | 99.6 /100 | #89 | Exceptional 3.31 |
| Menominee | 99.4 /100 | #90 | Exceptional 3.30 |
| Immigrants | Pakistan | 99.2 /100 | #91 | Exceptional 3.30 |
| Immigrants | Cameroon | 99.2 /100 | #92 | Exceptional 3.30 |
| Peruvians | 99.2 /100 | #93 | Exceptional 3.30 |
| Sierra Leoneans | 99.0 /100 | #94 | Exceptional 3.30 |
| Immigrants | Lebanon | 99.0 /100 | #95 | Exceptional 3.30 |
| U.S. Virgin Islanders | 98.8 /100 | #96 | Exceptional 3.29 |
| Immigrants | Oceania | 98.7 /100 | #97 | Exceptional 3.29 |
| Barbadians | 98.6 /100 | #98 | Exceptional 3.29 |