African vs Lumbee Average Family Size
COMPARE
African
Lumbee
Average Family Size
Average Family Size Comparison
Africans
Lumbee
3.25
AVERAGE FAMILY SIZE
84.9/ 100
METRIC RATING
134th/ 347
METRIC RANK
3.32
AVERAGE FAMILY SIZE
99.8/ 100
METRIC RATING
80th/ 347
METRIC RANK
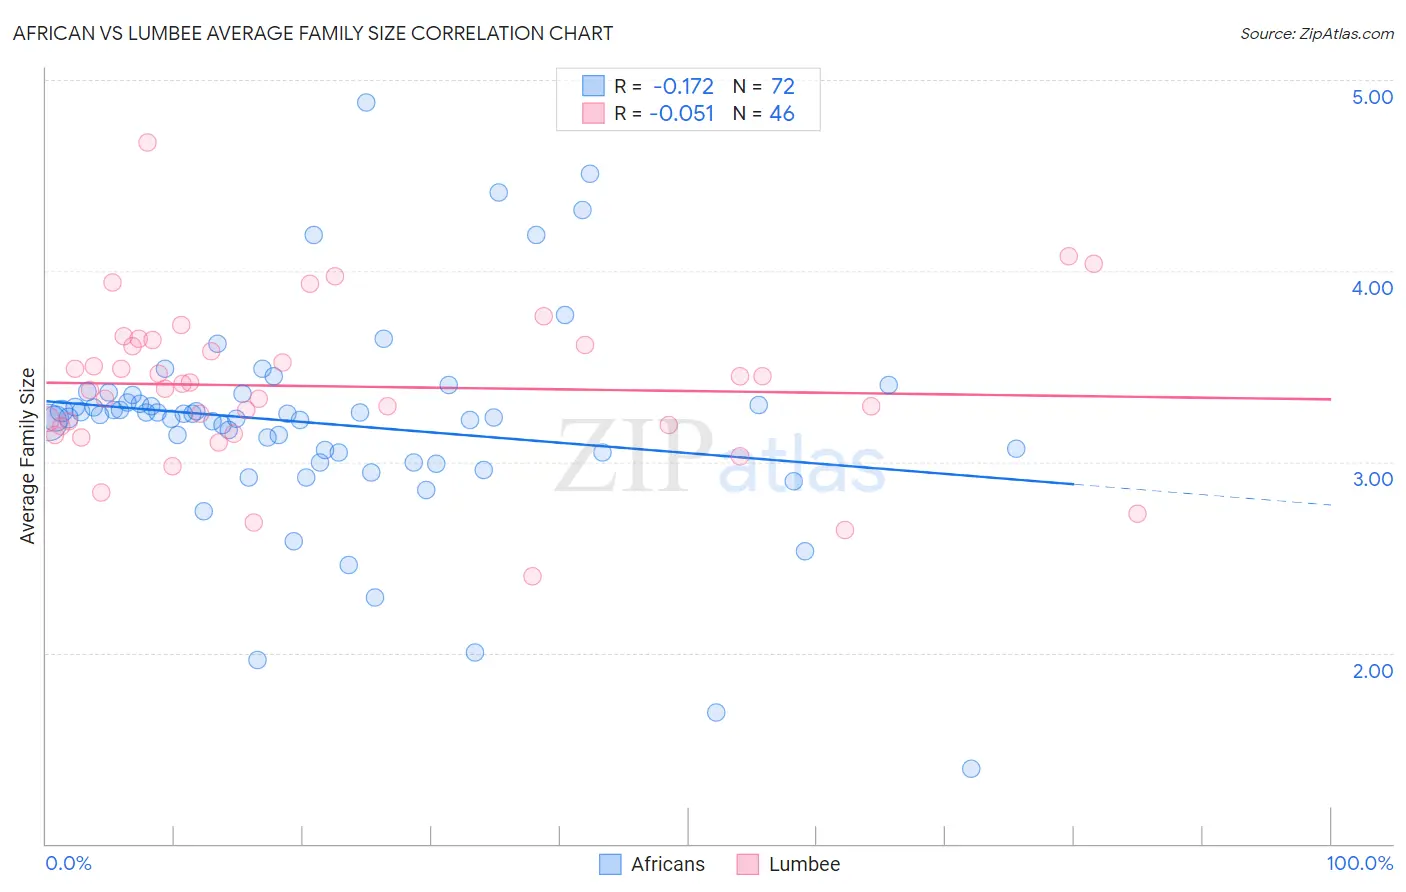
African vs Lumbee Average Family Size Correlation Chart
The statistical analysis conducted on geographies consisting of 469,598,302 people shows a poor negative correlation between the proportion of Africans and average family size in the United States with a correlation coefficient (R) of -0.172 and weighted average of 3.25. Similarly, the statistical analysis conducted on geographies consisting of 92,265,029 people shows a slight negative correlation between the proportion of Lumbee and average family size in the United States with a correlation coefficient (R) of -0.051 and weighted average of 3.32, a difference of 2.0%.
Average Family Size Correlation Summary
| Measurement | African | Lumbee |
| Minimum | 1.39 | 2.40 |
| Maximum | 4.88 | 4.67 |
| Range | 3.49 | 2.27 |
| Mean | 3.20 | 3.40 |
| Median | 3.24 | 3.40 |
| Interquartile 25% (IQ1) | 3.02 | 3.19 |
| Interquartile 75% (IQ3) | 3.33 | 3.61 |
| Interquartile Range (IQR) | 0.31 | 0.42 |
| Standard Deviation (Sample) | 0.56 | 0.41 |
| Standard Deviation (Population) | 0.55 | 0.41 |
Similar Demographics by Average Family Size
Demographics Similar to Africans by Average Family Size
In terms of average family size, the demographic groups most similar to Africans are Panamanian (3.25, a difference of 0.020%), Immigrants from Venezuela (3.26, a difference of 0.050%), Costa Rican (3.26, a difference of 0.070%), Comanche (3.25, a difference of 0.070%), and Immigrants from Middle Africa (3.25, a difference of 0.080%).
| Demographics | Rating | Rank | Average Family Size |
| Immigrants | Syria | 90.6 /100 | #127 | Exceptional 3.26 |
| Colombians | 89.9 /100 | #128 | Excellent 3.26 |
| Immigrants | Hong Kong | 88.6 /100 | #129 | Excellent 3.26 |
| Laotians | 88.5 /100 | #130 | Excellent 3.26 |
| Immigrants | Western Asia | 87.7 /100 | #131 | Excellent 3.26 |
| Costa Ricans | 86.8 /100 | #132 | Excellent 3.26 |
| Immigrants | Venezuela | 86.3 /100 | #133 | Excellent 3.26 |
| Africans | 84.9 /100 | #134 | Excellent 3.25 |
| Panamanians | 84.2 /100 | #135 | Excellent 3.25 |
| Comanche | 82.8 /100 | #136 | Excellent 3.25 |
| Immigrants | Middle Africa | 82.4 /100 | #137 | Excellent 3.25 |
| Cubans | 81.8 /100 | #138 | Excellent 3.25 |
| Immigrants | Ethiopia | 81.6 /100 | #139 | Excellent 3.25 |
| Sub-Saharan Africans | 81.6 /100 | #140 | Excellent 3.25 |
| Venezuelans | 81.4 /100 | #141 | Excellent 3.25 |
Demographics Similar to Lumbee by Average Family Size
In terms of average family size, the demographic groups most similar to Lumbee are British West Indian (3.32, a difference of 0.020%), Immigrants from Micronesia (3.32, a difference of 0.030%), Immigrants from Dominica (3.32, a difference of 0.040%), Immigrants from Ecuador (3.32, a difference of 0.070%), and Trinidadian and Tobagonian (3.32, a difference of 0.080%).
| Demographics | Rating | Rank | Average Family Size |
| Yaqui | 99.9 /100 | #73 | Exceptional 3.32 |
| Immigrants | Sierra Leone | 99.9 /100 | #74 | Exceptional 3.32 |
| Immigrants | Barbados | 99.8 /100 | #75 | Exceptional 3.32 |
| Trinidadians and Tobagonians | 99.8 /100 | #76 | Exceptional 3.32 |
| Immigrants | Ecuador | 99.8 /100 | #77 | Exceptional 3.32 |
| Immigrants | Micronesia | 99.8 /100 | #78 | Exceptional 3.32 |
| British West Indians | 99.8 /100 | #79 | Exceptional 3.32 |
| Lumbee | 99.8 /100 | #80 | Exceptional 3.32 |
| Immigrants | Dominica | 99.8 /100 | #81 | Exceptional 3.32 |
| Ecuadorians | 99.8 /100 | #82 | Exceptional 3.32 |
| Immigrants | Afghanistan | 99.8 /100 | #83 | Exceptional 3.32 |
| Immigrants | Nigeria | 99.7 /100 | #84 | Exceptional 3.32 |
| Afghans | 99.7 /100 | #85 | Exceptional 3.31 |
| Jamaicans | 99.7 /100 | #86 | Exceptional 3.31 |
| Immigrants | Peru | 99.7 /100 | #87 | Exceptional 3.31 |