Basque vs Immigrants from Israel Average Family Size
COMPARE
Basque
Immigrants from Israel
Average Family Size
Average Family Size Comparison
Basques
Immigrants from Israel
3.19
AVERAGE FAMILY SIZE
5.2/ 100
METRIC RATING
231st/ 347
METRIC RANK
3.22
AVERAGE FAMILY SIZE
29.3/ 100
METRIC RATING
193rd/ 347
METRIC RANK
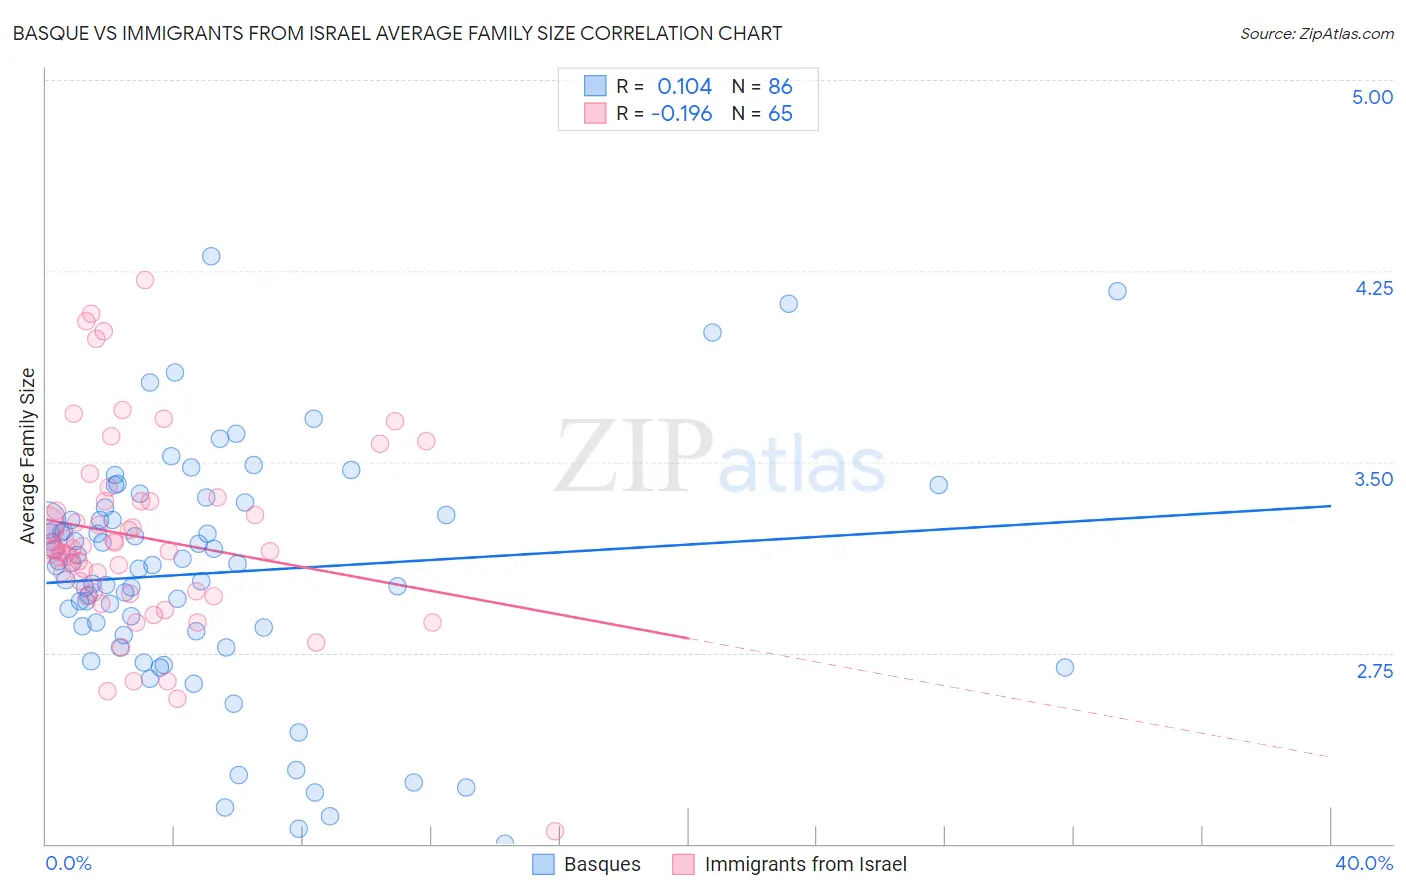
Basque vs Immigrants from Israel Average Family Size Correlation Chart
The statistical analysis conducted on geographies consisting of 165,752,068 people shows a poor positive correlation between the proportion of Basques and average family size in the United States with a correlation coefficient (R) of 0.104 and weighted average of 3.19. Similarly, the statistical analysis conducted on geographies consisting of 209,937,123 people shows a poor negative correlation between the proportion of Immigrants from Israel and average family size in the United States with a correlation coefficient (R) of -0.196 and weighted average of 3.22, a difference of 0.94%.
Average Family Size Correlation Summary
| Measurement | Basque | Immigrants from Israel |
| Minimum | 2.00 | 2.05 |
| Maximum | 4.31 | 4.21 |
| Range | 2.31 | 2.16 |
| Mean | 3.06 | 3.20 |
| Median | 3.10 | 3.16 |
| Interquartile 25% (IQ1) | 2.83 | 2.98 |
| Interquartile 75% (IQ3) | 3.29 | 3.35 |
| Interquartile Range (IQR) | 0.46 | 0.36 |
| Standard Deviation (Sample) | 0.47 | 0.38 |
| Standard Deviation (Population) | 0.46 | 0.38 |
Similar Demographics by Average Family Size
Demographics Similar to Basques by Average Family Size
In terms of average family size, the demographic groups most similar to Basques are Icelander (3.19, a difference of 0.0%), Immigrants from Italy (3.19, a difference of 0.010%), Cherokee (3.18, a difference of 0.040%), Nonimmigrants (3.19, a difference of 0.050%), and Portuguese (3.19, a difference of 0.070%).
| Demographics | Rating | Rank | Average Family Size |
| Syrians | 6.5 /100 | #224 | Tragic 3.19 |
| Cree | 6.2 /100 | #225 | Tragic 3.19 |
| Chickasaw | 6.0 /100 | #226 | Tragic 3.19 |
| Portuguese | 6.0 /100 | #227 | Tragic 3.19 |
| Immigrants | Nonimmigrants | 5.7 /100 | #228 | Tragic 3.19 |
| Immigrants | Italy | 5.3 /100 | #229 | Tragic 3.19 |
| Icelanders | 5.2 /100 | #230 | Tragic 3.19 |
| Basques | 5.2 /100 | #231 | Tragic 3.19 |
| Cherokee | 4.7 /100 | #232 | Tragic 3.18 |
| Brazilians | 4.5 /100 | #233 | Tragic 3.18 |
| Iranians | 4.5 /100 | #234 | Tragic 3.18 |
| Immigrants | Turkey | 4.2 /100 | #235 | Tragic 3.18 |
| Immigrants | Portugal | 4.2 /100 | #236 | Tragic 3.18 |
| Immigrants | Romania | 3.7 /100 | #237 | Tragic 3.18 |
| Romanians | 3.7 /100 | #238 | Tragic 3.18 |
Demographics Similar to Immigrants from Israel by Average Family Size
In terms of average family size, the demographic groups most similar to Immigrants from Israel are Immigrants from Sudan (3.22, a difference of 0.0%), Immigrants from Eastern Africa (3.22, a difference of 0.020%), Choctaw (3.21, a difference of 0.020%), Senegalese (3.21, a difference of 0.020%), and Immigrants from Zaire (3.22, a difference of 0.030%).
| Demographics | Rating | Rank | Average Family Size |
| Immigrants | Argentina | 39.8 /100 | #186 | Fair 3.22 |
| Immigrants | Malaysia | 39.0 /100 | #187 | Fair 3.22 |
| Thais | 38.3 /100 | #188 | Fair 3.22 |
| Pakistanis | 33.7 /100 | #189 | Fair 3.22 |
| Burmese | 31.0 /100 | #190 | Fair 3.22 |
| Immigrants | Zaire | 30.5 /100 | #191 | Fair 3.22 |
| Immigrants | Eastern Africa | 30.1 /100 | #192 | Fair 3.22 |
| Immigrants | Israel | 29.3 /100 | #193 | Fair 3.22 |
| Immigrants | Sudan | 29.1 /100 | #194 | Fair 3.22 |
| Choctaw | 28.3 /100 | #195 | Fair 3.21 |
| Senegalese | 28.2 /100 | #196 | Fair 3.21 |
| Kenyans | 28.0 /100 | #197 | Fair 3.21 |
| Immigrants | Azores | 21.7 /100 | #198 | Fair 3.21 |
| Hmong | 20.7 /100 | #199 | Fair 3.21 |
| Immigrants | Kenya | 19.2 /100 | #200 | Poor 3.21 |