Austrian vs Immigrants from Israel Bachelor's Degree
COMPARE
Austrian
Immigrants from Israel
Bachelor's Degree
Bachelor's Degree Comparison
Austrians
Immigrants from Israel
40.6%
BACHELOR'S DEGREE
95.5/ 100
METRIC RATING
117th/ 347
METRIC RANK
50.0%
BACHELOR'S DEGREE
100.0/ 100
METRIC RATING
9th/ 347
METRIC RANK
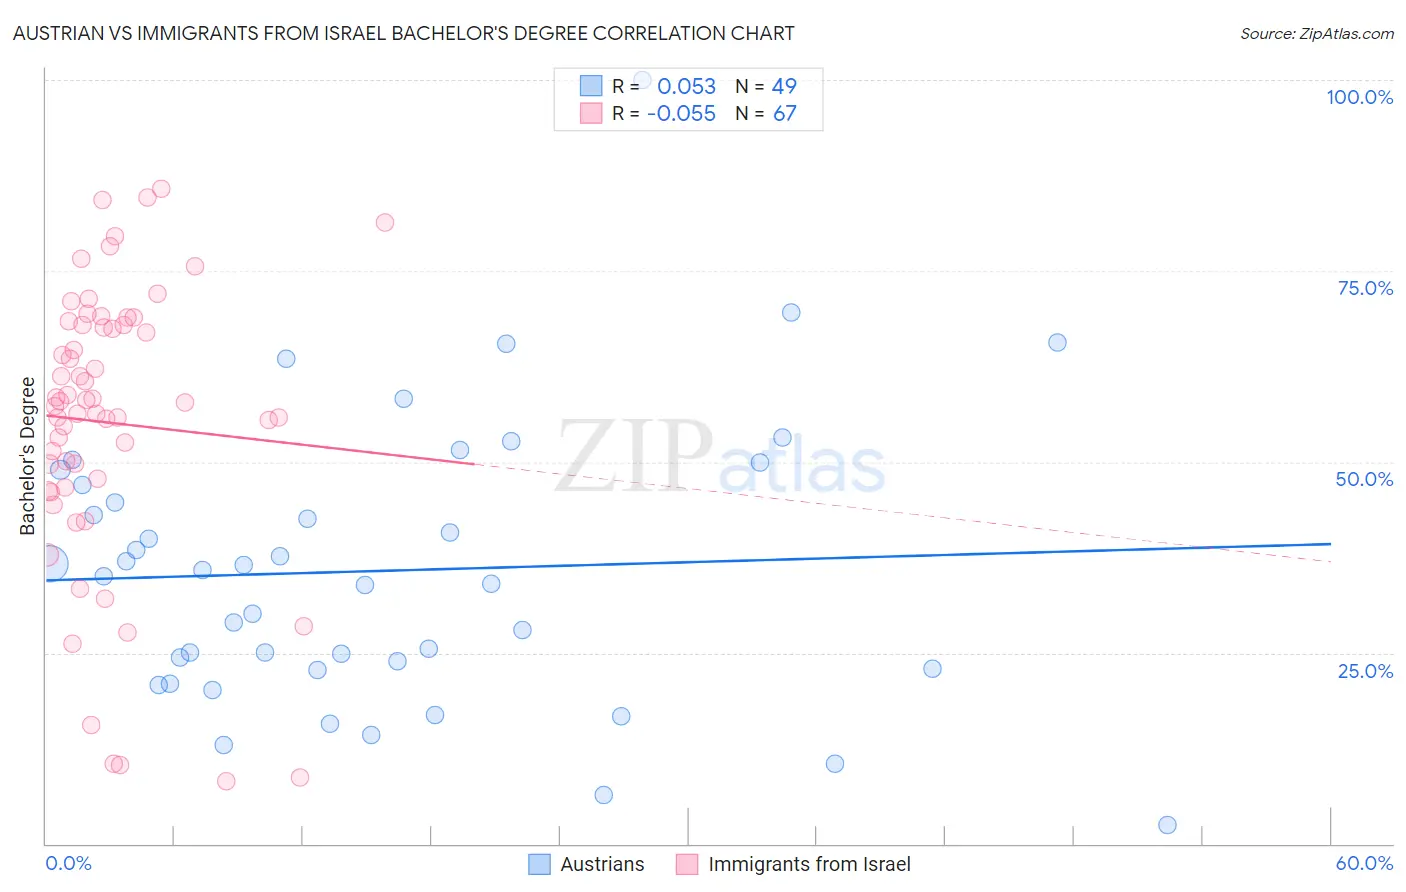
Austrian vs Immigrants from Israel Bachelor's Degree Correlation Chart
The statistical analysis conducted on geographies consisting of 452,047,267 people shows a slight positive correlation between the proportion of Austrians and percentage of population with at least bachelor's degree education in the United States with a correlation coefficient (R) of 0.053 and weighted average of 40.6%. Similarly, the statistical analysis conducted on geographies consisting of 210,024,310 people shows a slight negative correlation between the proportion of Immigrants from Israel and percentage of population with at least bachelor's degree education in the United States with a correlation coefficient (R) of -0.055 and weighted average of 50.0%, a difference of 23.0%.
Bachelor's Degree Correlation Summary
| Measurement | Austrian | Immigrants from Israel |
| Minimum | 2.4% | 8.2% |
| Maximum | 100.0% | 85.8% |
| Range | 97.6% | 77.5% |
| Mean | 35.7% | 55.1% |
| Median | 35.1% | 57.8% |
| Interquartile 25% (IQ1) | 22.9% | 46.6% |
| Interquartile 75% (IQ3) | 48.0% | 67.9% |
| Interquartile Range (IQR) | 25.1% | 21.3% |
| Standard Deviation (Sample) | 18.7% | 18.6% |
| Standard Deviation (Population) | 18.5% | 18.4% |
Similar Demographics by Bachelor's Degree
Demographics Similar to Austrians by Bachelor's Degree
In terms of bachelor's degree, the demographic groups most similar to Austrians are Croatian (40.6%, a difference of 0.020%), Immigrants from Uganda (40.7%, a difference of 0.10%), Palestinian (40.7%, a difference of 0.15%), Immigrants from Syria (40.5%, a difference of 0.34%), and Afghan (40.8%, a difference of 0.39%).
| Demographics | Rating | Rank | Bachelor's Degree |
| Albanians | 96.5 /100 | #110 | Exceptional 40.9% |
| Immigrants | Chile | 96.4 /100 | #111 | Exceptional 40.8% |
| Ugandans | 96.3 /100 | #112 | Exceptional 40.8% |
| Brazilians | 96.3 /100 | #113 | Exceptional 40.8% |
| Afghans | 96.2 /100 | #114 | Exceptional 40.8% |
| Palestinians | 95.8 /100 | #115 | Exceptional 40.7% |
| Immigrants | Uganda | 95.7 /100 | #116 | Exceptional 40.7% |
| Austrians | 95.5 /100 | #117 | Exceptional 40.6% |
| Croatians | 95.5 /100 | #118 | Exceptional 40.6% |
| Immigrants | Syria | 94.9 /100 | #119 | Exceptional 40.5% |
| Venezuelans | 94.7 /100 | #120 | Exceptional 40.5% |
| Moroccans | 94.6 /100 | #121 | Exceptional 40.5% |
| Immigrants | Albania | 94.4 /100 | #122 | Exceptional 40.4% |
| Lebanese | 94.3 /100 | #123 | Exceptional 40.4% |
| Immigrants | Eritrea | 94.3 /100 | #124 | Exceptional 40.4% |
Demographics Similar to Immigrants from Israel by Bachelor's Degree
In terms of bachelor's degree, the demographic groups most similar to Immigrants from Israel are Thai (50.1%, a difference of 0.24%), Immigrants from Iran (50.3%, a difference of 0.61%), Okinawan (50.5%, a difference of 1.1%), Iranian (51.0%, a difference of 1.9%), and Cypriot (49.0%, a difference of 1.9%).
| Demographics | Rating | Rank | Bachelor's Degree |
| Immigrants | Singapore | 100.0 /100 | #2 | Exceptional 51.9% |
| Immigrants | India | 100.0 /100 | #3 | Exceptional 51.3% |
| Immigrants | Taiwan | 100.0 /100 | #4 | Exceptional 51.2% |
| Iranians | 100.0 /100 | #5 | Exceptional 51.0% |
| Okinawans | 100.0 /100 | #6 | Exceptional 50.5% |
| Immigrants | Iran | 100.0 /100 | #7 | Exceptional 50.3% |
| Thais | 100.0 /100 | #8 | Exceptional 50.1% |
| Immigrants | Israel | 100.0 /100 | #9 | Exceptional 50.0% |
| Cypriots | 100.0 /100 | #10 | Exceptional 49.0% |
| Immigrants | Australia | 100.0 /100 | #11 | Exceptional 48.5% |
| Immigrants | China | 100.0 /100 | #12 | Exceptional 48.4% |
| Immigrants | South Central Asia | 100.0 /100 | #13 | Exceptional 48.3% |
| Immigrants | Hong Kong | 100.0 /100 | #14 | Exceptional 48.2% |
| Immigrants | Eastern Asia | 100.0 /100 | #15 | Exceptional 48.1% |
| Soviet Union | 100.0 /100 | #16 | Exceptional 47.9% |