Sudanese vs Immigrants from Israel Average Family Size
COMPARE
Sudanese
Immigrants from Israel
Average Family Size
Average Family Size Comparison
Sudanese
Immigrants from Israel
3.20
AVERAGE FAMILY SIZE
13.3/ 100
METRIC RATING
209th/ 347
METRIC RANK
3.22
AVERAGE FAMILY SIZE
29.3/ 100
METRIC RATING
193rd/ 347
METRIC RANK
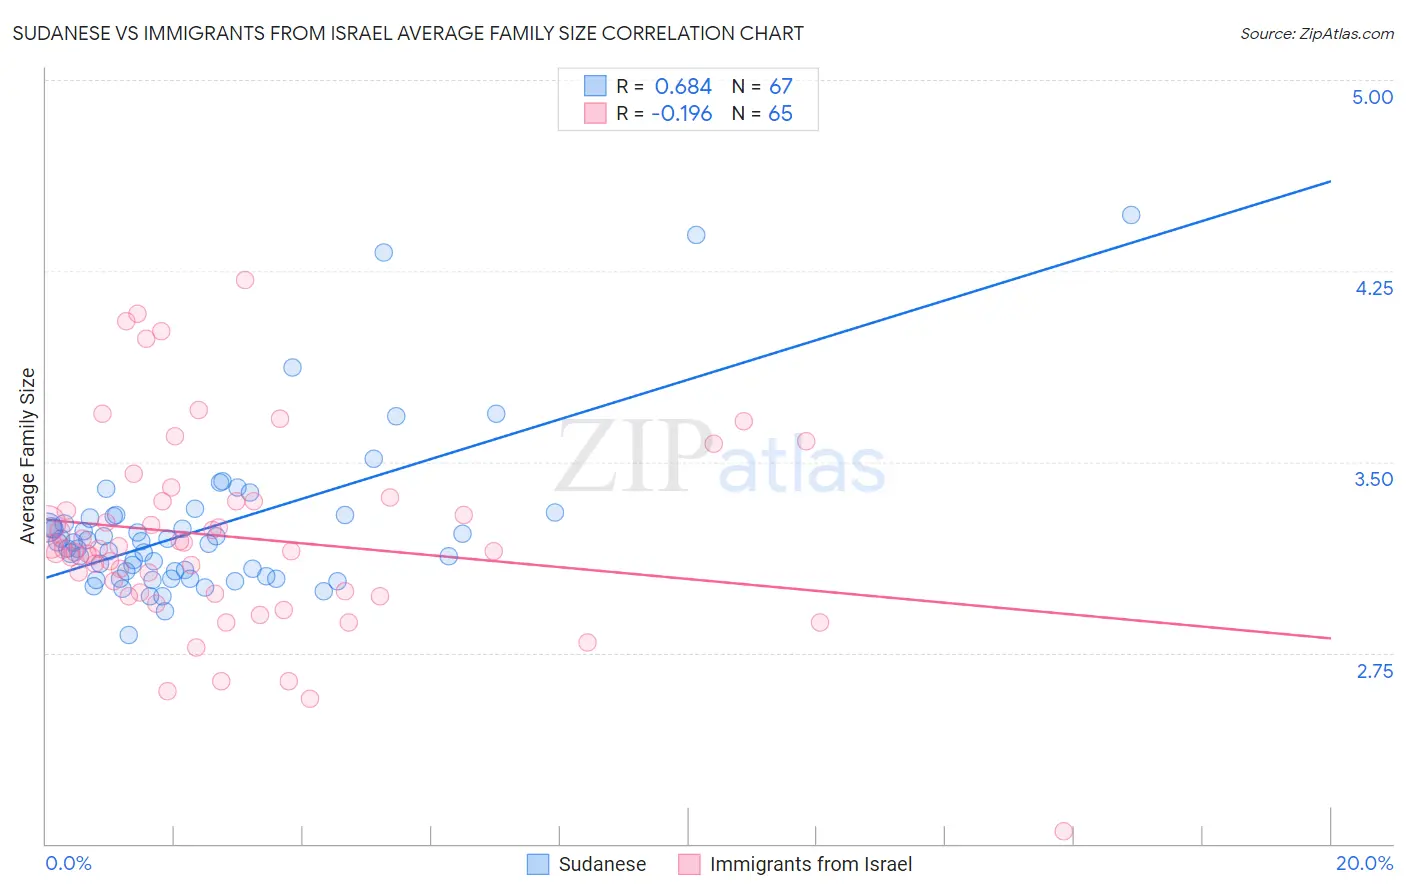
Sudanese vs Immigrants from Israel Average Family Size Correlation Chart
The statistical analysis conducted on geographies consisting of 110,078,191 people shows a significant positive correlation between the proportion of Sudanese and average family size in the United States with a correlation coefficient (R) of 0.684 and weighted average of 3.20. Similarly, the statistical analysis conducted on geographies consisting of 209,937,123 people shows a poor negative correlation between the proportion of Immigrants from Israel and average family size in the United States with a correlation coefficient (R) of -0.196 and weighted average of 3.22, a difference of 0.46%.
Average Family Size Correlation Summary
| Measurement | Sudanese | Immigrants from Israel |
| Minimum | 2.82 | 2.05 |
| Maximum | 4.47 | 4.21 |
| Range | 1.65 | 2.16 |
| Mean | 3.24 | 3.20 |
| Median | 3.18 | 3.16 |
| Interquartile 25% (IQ1) | 3.05 | 2.98 |
| Interquartile 75% (IQ3) | 3.28 | 3.35 |
| Interquartile Range (IQR) | 0.23 | 0.36 |
| Standard Deviation (Sample) | 0.31 | 0.38 |
| Standard Deviation (Population) | 0.31 | 0.38 |
Demographics Similar to Sudanese and Immigrants from Israel by Average Family Size
In terms of average family size, the demographic groups most similar to Sudanese are Chippewa (3.20, a difference of 0.0%), Filipino (3.20, a difference of 0.010%), Zimbabwean (3.20, a difference of 0.030%), Immigrants from Iran (3.20, a difference of 0.050%), and Immigrants from Cabo Verde (3.20, a difference of 0.10%). Similarly, the demographic groups most similar to Immigrants from Israel are Immigrants from Sudan (3.22, a difference of 0.0%), Immigrants from Eastern Africa (3.22, a difference of 0.020%), Choctaw (3.21, a difference of 0.020%), Senegalese (3.21, a difference of 0.020%), and Immigrants from Zaire (3.22, a difference of 0.030%).
| Demographics | Rating | Rank | Average Family Size |
| Immigrants | Zaire | 30.5 /100 | #191 | Fair 3.22 |
| Immigrants | Eastern Africa | 30.1 /100 | #192 | Fair 3.22 |
| Immigrants | Israel | 29.3 /100 | #193 | Fair 3.22 |
| Immigrants | Sudan | 29.1 /100 | #194 | Fair 3.22 |
| Choctaw | 28.3 /100 | #195 | Fair 3.21 |
| Senegalese | 28.2 /100 | #196 | Fair 3.21 |
| Kenyans | 28.0 /100 | #197 | Fair 3.21 |
| Immigrants | Azores | 21.7 /100 | #198 | Fair 3.21 |
| Hmong | 20.7 /100 | #199 | Fair 3.21 |
| Immigrants | Kenya | 19.2 /100 | #200 | Poor 3.21 |
| Immigrants | Morocco | 18.5 /100 | #201 | Poor 3.21 |
| Immigrants | India | 18.5 /100 | #202 | Poor 3.21 |
| Immigrants | Nepal | 18.1 /100 | #203 | Poor 3.21 |
| Immigrants | Poland | 16.6 /100 | #204 | Poor 3.20 |
| Paraguayans | 16.3 /100 | #205 | Poor 3.20 |
| Immigrants | Cabo Verde | 16.0 /100 | #206 | Poor 3.20 |
| Filipinos | 13.6 /100 | #207 | Poor 3.20 |
| Chippewa | 13.3 /100 | #208 | Poor 3.20 |
| Sudanese | 13.3 /100 | #209 | Poor 3.20 |
| Zimbabweans | 12.6 /100 | #210 | Poor 3.20 |
| Immigrants | Iran | 12.1 /100 | #211 | Poor 3.20 |