Assyrian/Chaldean/Syriac vs Puget Sound Salish Unemployment Among Ages 30 to 34 years
COMPARE
Assyrian/Chaldean/Syriac
Puget Sound Salish
Unemployment Among Ages 30 to 34 years
Unemployment Among Ages 30 to 34 years Comparison
Assyrians/Chaldeans/Syriacs
Puget Sound Salish
5.1%
UNEMPLOYMENT AMONG AGES 30 TO 34 YEARS
98.4/ 100
METRIC RATING
48th/ 347
METRIC RANK
5.1%
UNEMPLOYMENT AMONG AGES 30 TO 34 YEARS
98.2/ 100
METRIC RATING
50th/ 347
METRIC RANK
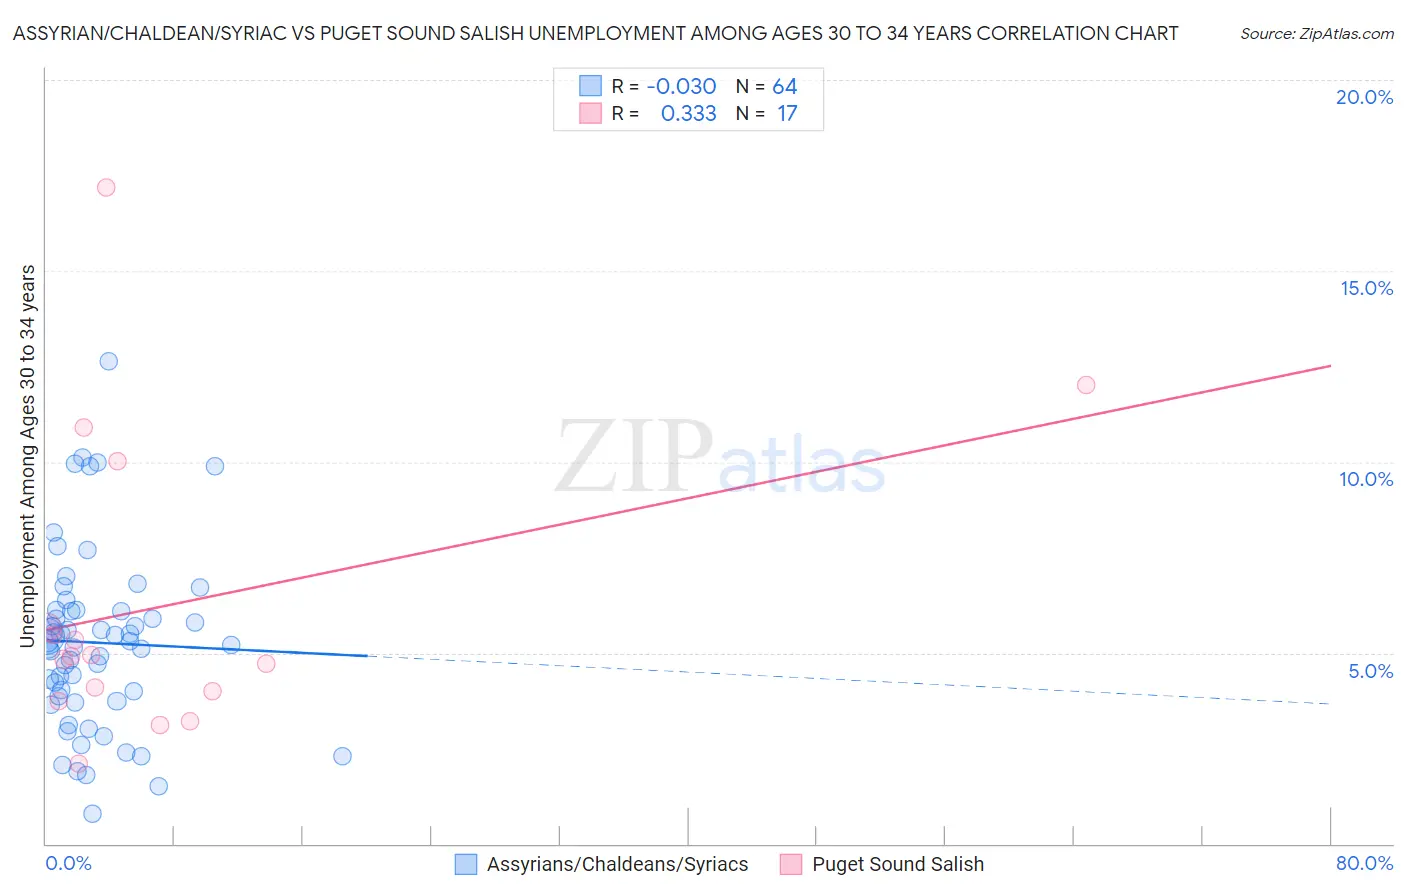
Assyrian/Chaldean/Syriac vs Puget Sound Salish Unemployment Among Ages 30 to 34 years Correlation Chart
The statistical analysis conducted on geographies consisting of 108,429,233 people shows no correlation between the proportion of Assyrians/Chaldeans/Syriacs and unemployment rate among population between the ages 30 and 34 in the United States with a correlation coefficient (R) of -0.030 and weighted average of 5.1%. Similarly, the statistical analysis conducted on geographies consisting of 45,325,090 people shows a mild positive correlation between the proportion of Puget Sound Salish and unemployment rate among population between the ages 30 and 34 in the United States with a correlation coefficient (R) of 0.333 and weighted average of 5.1%, a difference of 0.20%.
Unemployment Among Ages 30 to 34 years Correlation Summary
| Measurement | Assyrian/Chaldean/Syriac | Puget Sound Salish |
| Minimum | 0.80% | 2.1% |
| Maximum | 12.6% | 17.2% |
| Range | 11.8% | 15.1% |
| Mean | 5.3% | 6.2% |
| Median | 5.2% | 4.9% |
| Interquartile 25% (IQ1) | 3.8% | 3.9% |
| Interquartile 75% (IQ3) | 6.1% | 7.9% |
| Interquartile Range (IQR) | 2.3% | 4.0% |
| Standard Deviation (Sample) | 2.3% | 4.0% |
| Standard Deviation (Population) | 2.3% | 3.8% |
Demographics Similar to Assyrians/Chaldeans/Syriacs and Puget Sound Salish by Unemployment Among Ages 30 to 34 years
In terms of unemployment among ages 30 to 34 years, the demographic groups most similar to Assyrians/Chaldeans/Syriacs are Cypriot (5.1%, a difference of 0.020%), Immigrants from Congo (5.1%, a difference of 0.040%), Immigrants from Malaysia (5.1%, a difference of 0.12%), Turkish (5.1%, a difference of 0.23%), and Immigrants from Burma/Myanmar (5.1%, a difference of 0.27%). Similarly, the demographic groups most similar to Puget Sound Salish are Turkish (5.1%, a difference of 0.030%), Immigrants from Burma/Myanmar (5.1%, a difference of 0.070%), Immigrants from Malaysia (5.1%, a difference of 0.080%), Cuban (5.1%, a difference of 0.12%), and Cypriot (5.1%, a difference of 0.21%).
| Demographics | Rating | Rank | Unemployment Among Ages 30 to 34 years |
| Fijians | 99.0 /100 | #39 | Exceptional 5.0% |
| Immigrants | Vietnam | 98.9 /100 | #40 | Exceptional 5.0% |
| Immigrants | Eastern Africa | 98.9 /100 | #41 | Exceptional 5.0% |
| Immigrants | Hong Kong | 98.8 /100 | #42 | Exceptional 5.0% |
| Soviet Union | 98.8 /100 | #43 | Exceptional 5.0% |
| Immigrants | Belgium | 98.7 /100 | #44 | Exceptional 5.1% |
| Yugoslavians | 98.6 /100 | #45 | Exceptional 5.1% |
| Immigrants | Congo | 98.4 /100 | #46 | Exceptional 5.1% |
| Cypriots | 98.4 /100 | #47 | Exceptional 5.1% |
| Assyrians/Chaldeans/Syriacs | 98.4 /100 | #48 | Exceptional 5.1% |
| Immigrants | Malaysia | 98.3 /100 | #49 | Exceptional 5.1% |
| Puget Sound Salish | 98.2 /100 | #50 | Exceptional 5.1% |
| Turks | 98.2 /100 | #51 | Exceptional 5.1% |
| Immigrants | Burma/Myanmar | 98.1 /100 | #52 | Exceptional 5.1% |
| Cubans | 98.1 /100 | #53 | Exceptional 5.1% |
| Immigrants | Morocco | 97.9 /100 | #54 | Exceptional 5.1% |
| Chinese | 97.7 /100 | #55 | Exceptional 5.1% |
| Immigrants | Serbia | 97.4 /100 | #56 | Exceptional 5.1% |
| Immigrants | China | 97.2 /100 | #57 | Exceptional 5.1% |
| Asians | 97.2 /100 | #58 | Exceptional 5.1% |
| Swedes | 97.1 /100 | #59 | Exceptional 5.1% |