Immigrants from Congo vs Puget Sound Salish Single Mother Households
COMPARE
Immigrants from Congo
Puget Sound Salish
Single Mother Households
Single Mother Households Comparison
Immigrants from Congo
Puget Sound Salish
8.1%
SINGLE MOTHER HOUSEHOLDS
0.0/ 100
METRIC RATING
311th/ 347
METRIC RANK
6.3%
SINGLE MOTHER HOUSEHOLDS
58.1/ 100
METRIC RATING
169th/ 347
METRIC RANK
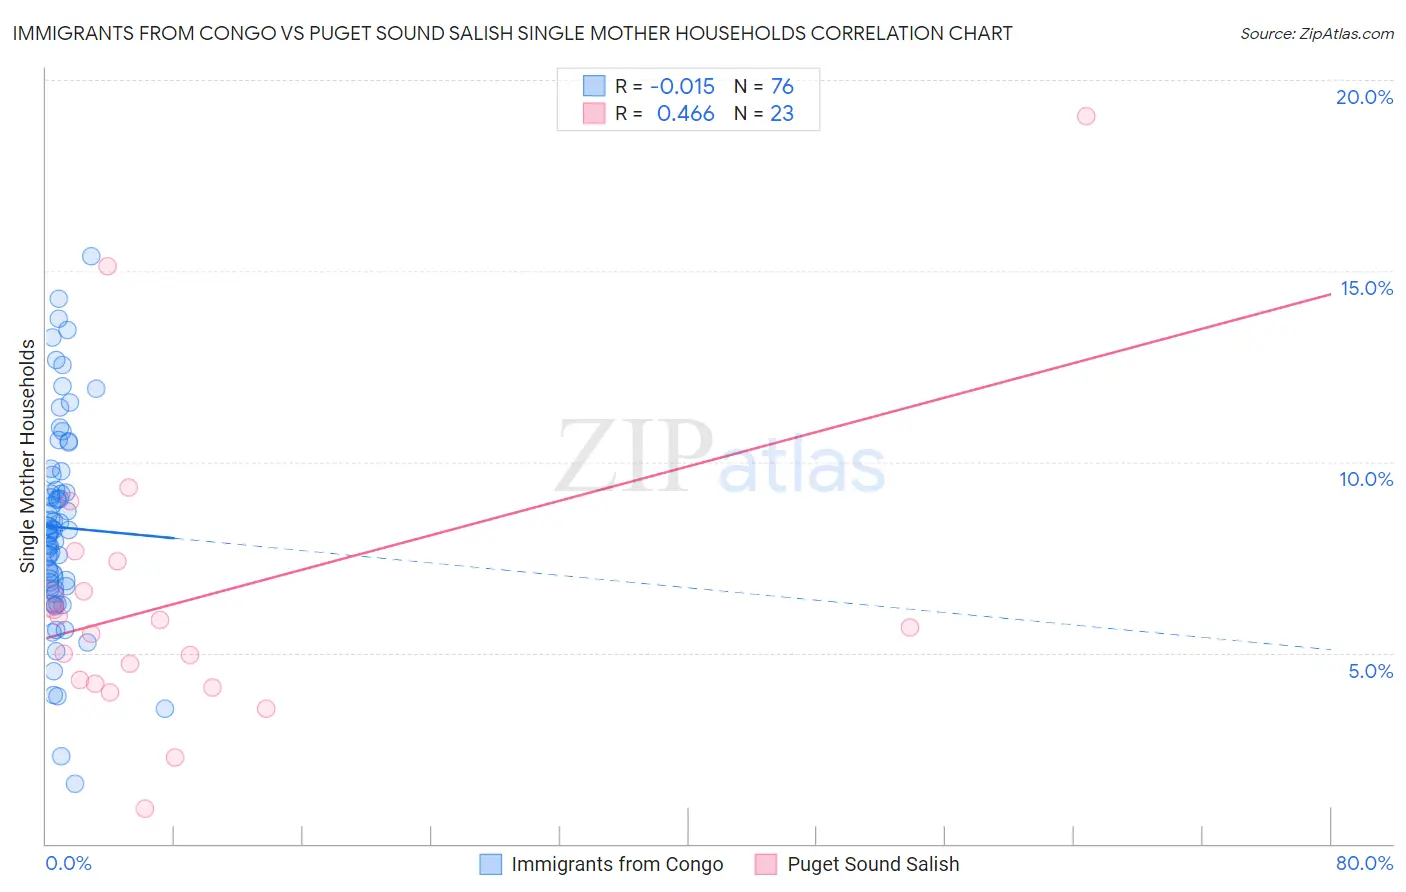
Immigrants from Congo vs Puget Sound Salish Single Mother Households Correlation Chart
The statistical analysis conducted on geographies consisting of 92,069,914 people shows no correlation between the proportion of Immigrants from Congo and percentage of single mother households in the United States with a correlation coefficient (R) of -0.015 and weighted average of 8.1%. Similarly, the statistical analysis conducted on geographies consisting of 46,127,727 people shows a moderate positive correlation between the proportion of Puget Sound Salish and percentage of single mother households in the United States with a correlation coefficient (R) of 0.466 and weighted average of 6.3%, a difference of 29.8%.
Single Mother Households Correlation Summary
| Measurement | Immigrants from Congo | Puget Sound Salish |
| Minimum | 1.6% | 0.93% |
| Maximum | 15.4% | 19.0% |
| Range | 13.8% | 18.1% |
| Mean | 8.3% | 6.4% |
| Median | 8.2% | 5.7% |
| Interquartile 25% (IQ1) | 6.7% | 4.2% |
| Interquartile 75% (IQ3) | 9.5% | 7.4% |
| Interquartile Range (IQR) | 2.7% | 3.2% |
| Standard Deviation (Sample) | 2.7% | 3.9% |
| Standard Deviation (Population) | 2.7% | 3.8% |
Similar Demographics by Single Mother Households
Demographics Similar to Immigrants from Congo by Single Mother Households
In terms of single mother households, the demographic groups most similar to Immigrants from Congo are Honduran (8.1%, a difference of 0.29%), Bangladeshi (8.1%, a difference of 0.29%), Cheyenne (8.1%, a difference of 0.35%), Immigrants from Grenada (8.2%, a difference of 0.45%), and Immigrants from Mexico (8.2%, a difference of 0.57%).
| Demographics | Rating | Rank | Single Mother Households |
| Natives/Alaskans | 0.0 /100 | #304 | Tragic 8.0% |
| Colville | 0.0 /100 | #305 | Tragic 8.0% |
| Immigrants | Barbados | 0.0 /100 | #306 | Tragic 8.0% |
| Immigrants | St. Vincent and the Grenadines | 0.0 /100 | #307 | Tragic 8.0% |
| Immigrants | Central America | 0.0 /100 | #308 | Tragic 8.1% |
| Cheyenne | 0.0 /100 | #309 | Tragic 8.1% |
| Hondurans | 0.0 /100 | #310 | Tragic 8.1% |
| Immigrants | Congo | 0.0 /100 | #311 | Tragic 8.1% |
| Bangladeshis | 0.0 /100 | #312 | Tragic 8.1% |
| Immigrants | Grenada | 0.0 /100 | #313 | Tragic 8.2% |
| Immigrants | Mexico | 0.0 /100 | #314 | Tragic 8.2% |
| Immigrants | Western Africa | 0.0 /100 | #315 | Tragic 8.2% |
| Africans | 0.0 /100 | #316 | Tragic 8.2% |
| Immigrants | Honduras | 0.0 /100 | #317 | Tragic 8.2% |
| Senegalese | 0.0 /100 | #318 | Tragic 8.2% |
Demographics Similar to Puget Sound Salish by Single Mother Households
In terms of single mother households, the demographic groups most similar to Puget Sound Salish are Immigrants from Chile (6.3%, a difference of 0.020%), Brazilian (6.2%, a difference of 0.11%), Immigrants from Oceania (6.3%, a difference of 0.40%), Afghan (6.3%, a difference of 0.63%), and Immigrants from South Eastern Asia (6.3%, a difference of 0.66%).
| Demographics | Rating | Rank | Single Mother Households |
| Immigrants | Zimbabwe | 69.9 /100 | #162 | Good 6.2% |
| Alsatians | 68.7 /100 | #163 | Good 6.2% |
| Immigrants | Northern Africa | 68.0 /100 | #164 | Good 6.2% |
| Immigrants | Syria | 67.4 /100 | #165 | Good 6.2% |
| Sri Lankans | 63.9 /100 | #166 | Good 6.2% |
| Brazilians | 59.1 /100 | #167 | Average 6.2% |
| Immigrants | Chile | 58.3 /100 | #168 | Average 6.3% |
| Puget Sound Salish | 58.1 /100 | #169 | Average 6.3% |
| Immigrants | Oceania | 54.6 /100 | #170 | Average 6.3% |
| Afghans | 52.5 /100 | #171 | Average 6.3% |
| Immigrants | South Eastern Asia | 52.2 /100 | #172 | Average 6.3% |
| Immigrants | Vietnam | 51.5 /100 | #173 | Average 6.3% |
| Immigrants | Morocco | 50.0 /100 | #174 | Average 6.3% |
| Marshallese | 45.8 /100 | #175 | Average 6.3% |
| Immigrants | Bosnia and Herzegovina | 44.3 /100 | #176 | Average 6.3% |