Assyrian/Chaldean/Syriac vs Puget Sound Salish 10th Grade
COMPARE
Assyrian/Chaldean/Syriac
Puget Sound Salish
10th Grade
10th Grade Comparison
Assyrians/Chaldeans/Syriacs
Puget Sound Salish
93.9%
10TH GRADE
69.7/ 100
METRIC RATING
161st/ 347
METRIC RANK
94.7%
10TH GRADE
99.0/ 100
METRIC RATING
86th/ 347
METRIC RANK
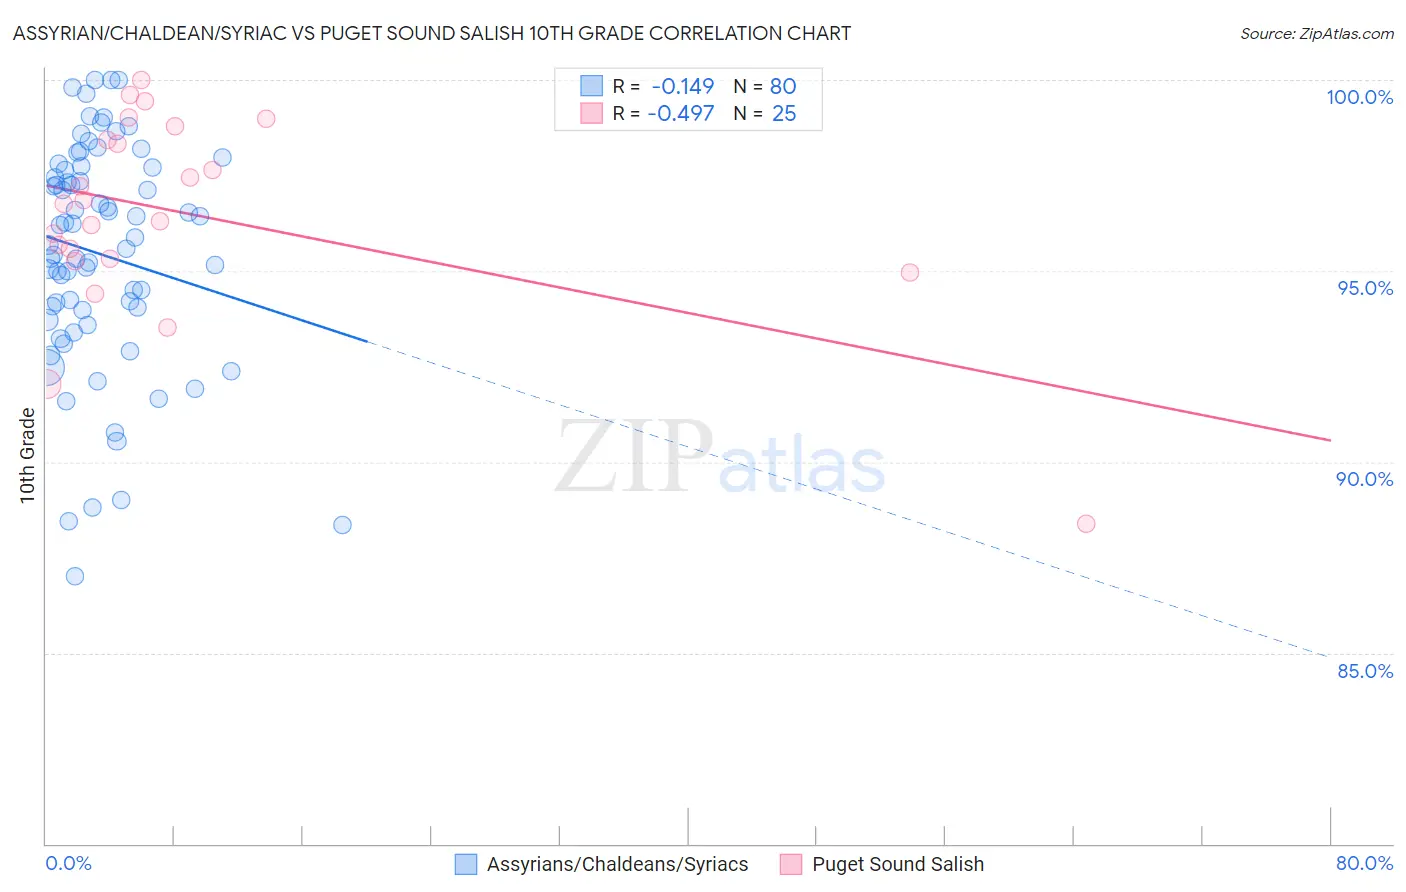
Assyrian/Chaldean/Syriac vs Puget Sound Salish 10th Grade Correlation Chart
The statistical analysis conducted on geographies consisting of 110,318,125 people shows a poor negative correlation between the proportion of Assyrians/Chaldeans/Syriacs and percentage of population with at least 10th grade education in the United States with a correlation coefficient (R) of -0.149 and weighted average of 93.9%. Similarly, the statistical analysis conducted on geographies consisting of 46,155,775 people shows a moderate negative correlation between the proportion of Puget Sound Salish and percentage of population with at least 10th grade education in the United States with a correlation coefficient (R) of -0.497 and weighted average of 94.7%, a difference of 0.85%.
10th Grade Correlation Summary
| Measurement | Assyrian/Chaldean/Syriac | Puget Sound Salish |
| Minimum | 87.0% | 88.4% |
| Maximum | 100.0% | 100.0% |
| Range | 13.0% | 11.6% |
| Mean | 95.4% | 96.5% |
| Median | 95.8% | 96.8% |
| Interquartile 25% (IQ1) | 93.9% | 95.3% |
| Interquartile 75% (IQ3) | 97.7% | 98.6% |
| Interquartile Range (IQR) | 3.8% | 3.3% |
| Standard Deviation (Sample) | 3.0% | 2.6% |
| Standard Deviation (Population) | 2.9% | 2.6% |
Similar Demographics by 10th Grade
Demographics Similar to Assyrians/Chaldeans/Syriacs by 10th Grade
In terms of 10th grade, the demographic groups most similar to Assyrians/Chaldeans/Syriacs are Pakistani (93.9%, a difference of 0.0%), Immigrants from Poland (93.9%, a difference of 0.0%), Venezuelan (93.9%, a difference of 0.0%), Bermudan (93.9%, a difference of 0.010%), and Chilean (93.9%, a difference of 0.010%).
| Demographics | Rating | Rank | 10th Grade |
| Immigrants | Kenya | 75.3 /100 | #154 | Good 94.0% |
| Spanish | 74.9 /100 | #155 | Good 94.0% |
| Mongolians | 74.4 /100 | #156 | Good 94.0% |
| Kiowa | 73.3 /100 | #157 | Good 93.9% |
| Bermudans | 71.0 /100 | #158 | Good 93.9% |
| Chileans | 70.2 /100 | #159 | Good 93.9% |
| Pakistanis | 70.1 /100 | #160 | Good 93.9% |
| Assyrians/Chaldeans/Syriacs | 69.7 /100 | #161 | Good 93.9% |
| Immigrants | Poland | 69.6 /100 | #162 | Good 93.9% |
| Venezuelans | 69.5 /100 | #163 | Good 93.9% |
| Iraqis | 68.1 /100 | #164 | Good 93.9% |
| Brazilians | 63.6 /100 | #165 | Good 93.8% |
| Immigrants | Iraq | 63.0 /100 | #166 | Good 93.8% |
| Immigrants | Egypt | 62.3 /100 | #167 | Good 93.8% |
| Alsatians | 59.4 /100 | #168 | Average 93.8% |
Demographics Similar to Puget Sound Salish by 10th Grade
In terms of 10th grade, the demographic groups most similar to Puget Sound Salish are Crow (94.7%, a difference of 0.0%), Immigrants from Western Europe (94.7%, a difference of 0.010%), Icelander (94.7%, a difference of 0.010%), Immigrants from Saudi Arabia (94.7%, a difference of 0.010%), and Immigrants from Japan (94.7%, a difference of 0.010%).
| Demographics | Rating | Rank | 10th Grade |
| Immigrants | Czechoslovakia | 99.2 /100 | #79 | Exceptional 94.7% |
| Immigrants | Denmark | 99.2 /100 | #80 | Exceptional 94.7% |
| Immigrants | Latvia | 99.2 /100 | #81 | Exceptional 94.7% |
| Swiss | 99.1 /100 | #82 | Exceptional 94.7% |
| Immigrants | Western Europe | 99.1 /100 | #83 | Exceptional 94.7% |
| Icelanders | 99.1 /100 | #84 | Exceptional 94.7% |
| Crow | 99.0 /100 | #85 | Exceptional 94.7% |
| Puget Sound Salish | 99.0 /100 | #86 | Exceptional 94.7% |
| Immigrants | Saudi Arabia | 99.0 /100 | #87 | Exceptional 94.7% |
| Immigrants | Japan | 99.0 /100 | #88 | Exceptional 94.7% |
| Immigrants | Moldova | 98.9 /100 | #89 | Exceptional 94.7% |
| South Africans | 98.8 /100 | #90 | Exceptional 94.7% |
| Whites/Caucasians | 98.8 /100 | #91 | Exceptional 94.7% |
| Yugoslavians | 98.4 /100 | #92 | Exceptional 94.6% |
| Soviet Union | 98.3 /100 | #93 | Exceptional 94.6% |