Subsaharan African vs Puget Sound Salish Single Mother Households
COMPARE
Subsaharan African
Puget Sound Salish
Single Mother Households
Single Mother Households Comparison
Sub-Saharan Africans
Puget Sound Salish
7.8%
SINGLE MOTHER HOUSEHOLDS
0.0/ 100
METRIC RATING
289th/ 347
METRIC RANK
6.3%
SINGLE MOTHER HOUSEHOLDS
58.1/ 100
METRIC RATING
169th/ 347
METRIC RANK
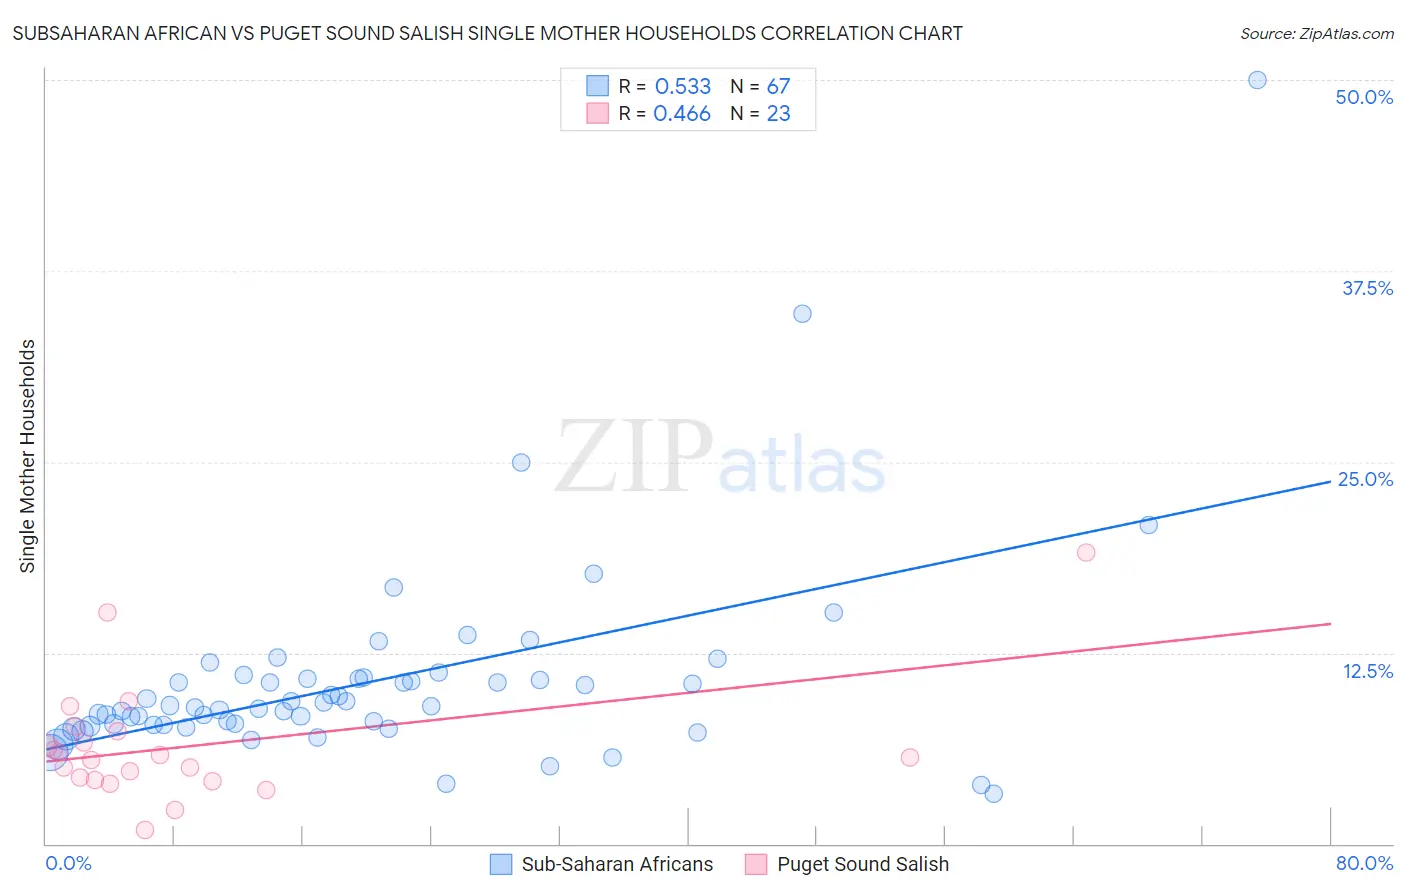
Subsaharan African vs Puget Sound Salish Single Mother Households Correlation Chart
The statistical analysis conducted on geographies consisting of 505,994,563 people shows a substantial positive correlation between the proportion of Sub-Saharan Africans and percentage of single mother households in the United States with a correlation coefficient (R) of 0.533 and weighted average of 7.8%. Similarly, the statistical analysis conducted on geographies consisting of 46,127,727 people shows a moderate positive correlation between the proportion of Puget Sound Salish and percentage of single mother households in the United States with a correlation coefficient (R) of 0.466 and weighted average of 6.3%, a difference of 24.8%.
Single Mother Households Correlation Summary
| Measurement | Subsaharan African | Puget Sound Salish |
| Minimum | 3.2% | 0.93% |
| Maximum | 50.0% | 19.0% |
| Range | 46.8% | 18.1% |
| Mean | 10.6% | 6.4% |
| Median | 9.0% | 5.7% |
| Interquartile 25% (IQ1) | 7.8% | 4.2% |
| Interquartile 75% (IQ3) | 10.8% | 7.4% |
| Interquartile Range (IQR) | 3.0% | 3.2% |
| Standard Deviation (Sample) | 6.8% | 3.9% |
| Standard Deviation (Population) | 6.7% | 3.8% |
Similar Demographics by Single Mother Households
Demographics Similar to Sub-Saharan Africans by Single Mother Households
In terms of single mother households, the demographic groups most similar to Sub-Saharan Africans are Immigrants from Nigeria (7.8%, a difference of 0.42%), West Indian (7.8%, a difference of 0.50%), Ghanaian (7.8%, a difference of 0.51%), Immigrants from Cameroon (7.9%, a difference of 0.87%), and Sierra Leonean (7.7%, a difference of 0.92%).
| Demographics | Rating | Rank | Single Mother Households |
| Guatemalans | 0.0 /100 | #282 | Tragic 7.7% |
| Nigerians | 0.0 /100 | #283 | Tragic 7.7% |
| Immigrants | Belize | 0.0 /100 | #284 | Tragic 7.7% |
| Trinidadians and Tobagonians | 0.0 /100 | #285 | Tragic 7.7% |
| Immigrants | Middle Africa | 0.0 /100 | #286 | Tragic 7.7% |
| Immigrants | Guatemala | 0.0 /100 | #287 | Tragic 7.7% |
| Sierra Leoneans | 0.0 /100 | #288 | Tragic 7.7% |
| Sub-Saharan Africans | 0.0 /100 | #289 | Tragic 7.8% |
| Immigrants | Nigeria | 0.0 /100 | #290 | Tragic 7.8% |
| West Indians | 0.0 /100 | #291 | Tragic 7.8% |
| Ghanaians | 0.0 /100 | #292 | Tragic 7.8% |
| Immigrants | Cameroon | 0.0 /100 | #293 | Tragic 7.9% |
| Apache | 0.0 /100 | #294 | Tragic 7.9% |
| Barbadians | 0.0 /100 | #295 | Tragic 7.9% |
| Immigrants | Latin America | 0.0 /100 | #296 | Tragic 7.9% |
Demographics Similar to Puget Sound Salish by Single Mother Households
In terms of single mother households, the demographic groups most similar to Puget Sound Salish are Immigrants from Chile (6.3%, a difference of 0.020%), Brazilian (6.2%, a difference of 0.11%), Immigrants from Oceania (6.3%, a difference of 0.40%), Afghan (6.3%, a difference of 0.63%), and Immigrants from South Eastern Asia (6.3%, a difference of 0.66%).
| Demographics | Rating | Rank | Single Mother Households |
| Immigrants | Zimbabwe | 69.9 /100 | #162 | Good 6.2% |
| Alsatians | 68.7 /100 | #163 | Good 6.2% |
| Immigrants | Northern Africa | 68.0 /100 | #164 | Good 6.2% |
| Immigrants | Syria | 67.4 /100 | #165 | Good 6.2% |
| Sri Lankans | 63.9 /100 | #166 | Good 6.2% |
| Brazilians | 59.1 /100 | #167 | Average 6.2% |
| Immigrants | Chile | 58.3 /100 | #168 | Average 6.3% |
| Puget Sound Salish | 58.1 /100 | #169 | Average 6.3% |
| Immigrants | Oceania | 54.6 /100 | #170 | Average 6.3% |
| Afghans | 52.5 /100 | #171 | Average 6.3% |
| Immigrants | South Eastern Asia | 52.2 /100 | #172 | Average 6.3% |
| Immigrants | Vietnam | 51.5 /100 | #173 | Average 6.3% |
| Immigrants | Morocco | 50.0 /100 | #174 | Average 6.3% |
| Marshallese | 45.8 /100 | #175 | Average 6.3% |
| Immigrants | Bosnia and Herzegovina | 44.3 /100 | #176 | Average 6.3% |