Armenian vs Immigrants from Philippines Single Mother Households
COMPARE
Armenian
Immigrants from Philippines
Single Mother Households
Single Mother Households Comparison
Armenians
Immigrants from Philippines
5.2%
SINGLE MOTHER HOUSEHOLDS
99.8/ 100
METRIC RATING
24th/ 347
METRIC RANK
6.1%
SINGLE MOTHER HOUSEHOLDS
78.5/ 100
METRIC RATING
154th/ 347
METRIC RANK
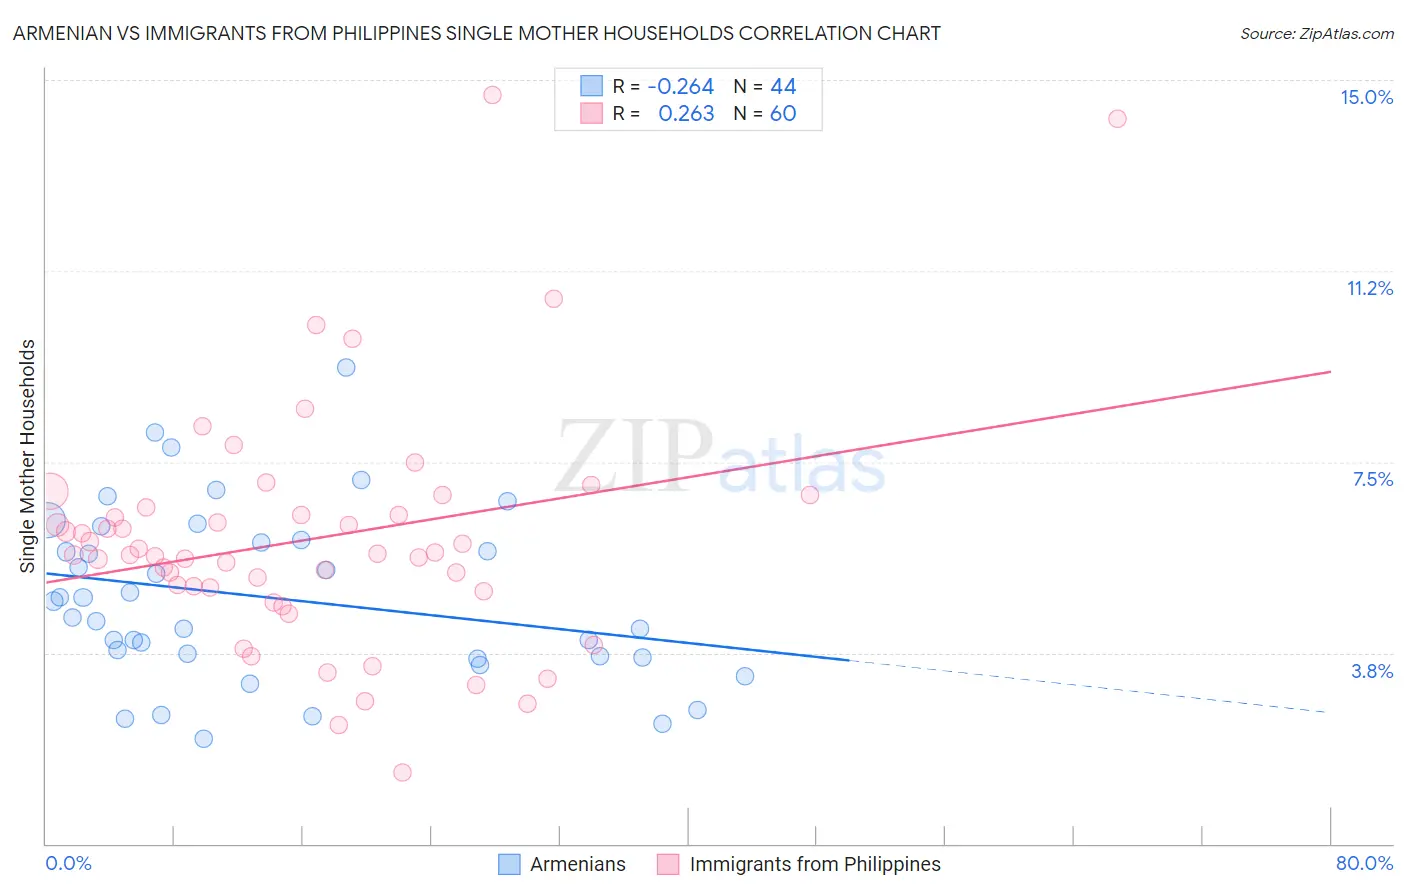
Armenian vs Immigrants from Philippines Single Mother Households Correlation Chart
The statistical analysis conducted on geographies consisting of 310,071,086 people shows a weak negative correlation between the proportion of Armenians and percentage of single mother households in the United States with a correlation coefficient (R) of -0.264 and weighted average of 5.2%. Similarly, the statistical analysis conducted on geographies consisting of 469,636,643 people shows a weak positive correlation between the proportion of Immigrants from Philippines and percentage of single mother households in the United States with a correlation coefficient (R) of 0.263 and weighted average of 6.1%, a difference of 16.3%.
Single Mother Households Correlation Summary
| Measurement | Armenian | Immigrants from Philippines |
| Minimum | 2.1% | 1.4% |
| Maximum | 9.4% | 14.7% |
| Range | 7.3% | 13.3% |
| Mean | 4.8% | 6.0% |
| Median | 4.6% | 5.7% |
| Interquartile 25% (IQ1) | 3.7% | 5.0% |
| Interquartile 75% (IQ3) | 5.9% | 6.5% |
| Interquartile Range (IQR) | 2.3% | 1.5% |
| Standard Deviation (Sample) | 1.7% | 2.4% |
| Standard Deviation (Population) | 1.7% | 2.4% |
Similar Demographics by Single Mother Households
Demographics Similar to Armenians by Single Mother Households
In terms of single mother households, the demographic groups most similar to Armenians are Immigrants from Austria (5.2%, a difference of 0.060%), Thai (5.2%, a difference of 0.11%), Immigrants from Japan (5.2%, a difference of 0.34%), Immigrants from Lithuania (5.3%, a difference of 0.36%), and Eastern European (5.2%, a difference of 0.83%).
| Demographics | Rating | Rank | Single Mother Households |
| Soviet Union | 99.9 /100 | #17 | Exceptional 5.1% |
| Immigrants | Armenia | 99.9 /100 | #18 | Exceptional 5.2% |
| Chinese | 99.9 /100 | #19 | Exceptional 5.2% |
| Maltese | 99.9 /100 | #20 | Exceptional 5.2% |
| Eastern Europeans | 99.8 /100 | #21 | Exceptional 5.2% |
| Thais | 99.8 /100 | #22 | Exceptional 5.2% |
| Immigrants | Austria | 99.8 /100 | #23 | Exceptional 5.2% |
| Armenians | 99.8 /100 | #24 | Exceptional 5.2% |
| Immigrants | Japan | 99.8 /100 | #25 | Exceptional 5.2% |
| Immigrants | Lithuania | 99.8 /100 | #26 | Exceptional 5.3% |
| Bhutanese | 99.7 /100 | #27 | Exceptional 5.3% |
| Russians | 99.7 /100 | #28 | Exceptional 5.3% |
| Latvians | 99.7 /100 | #29 | Exceptional 5.3% |
| Burmese | 99.7 /100 | #30 | Exceptional 5.3% |
| Immigrants | Korea | 99.7 /100 | #31 | Exceptional 5.3% |
Demographics Similar to Immigrants from Philippines by Single Mother Households
In terms of single mother households, the demographic groups most similar to Immigrants from Philippines are Immigrants from Brazil (6.1%, a difference of 0.070%), Pakistani (6.1%, a difference of 0.11%), White/Caucasian (6.1%, a difference of 0.33%), Immigrants from Southern Europe (6.1%, a difference of 0.34%), and Zimbabwean (6.1%, a difference of 0.39%).
| Demographics | Rating | Rank | Single Mother Households |
| Immigrants | Jordan | 82.3 /100 | #147 | Excellent 6.0% |
| Scotch-Irish | 82.0 /100 | #148 | Excellent 6.0% |
| Immigrants | Albania | 81.5 /100 | #149 | Excellent 6.1% |
| Zimbabweans | 80.7 /100 | #150 | Excellent 6.1% |
| Immigrants | Southern Europe | 80.5 /100 | #151 | Excellent 6.1% |
| Pakistanis | 79.2 /100 | #152 | Good 6.1% |
| Immigrants | Brazil | 78.9 /100 | #153 | Good 6.1% |
| Immigrants | Philippines | 78.5 /100 | #154 | Good 6.1% |
| Whites/Caucasians | 76.5 /100 | #155 | Good 6.1% |
| Native Hawaiians | 75.0 /100 | #156 | Good 6.1% |
| Chileans | 74.2 /100 | #157 | Good 6.1% |
| Celtics | 73.3 /100 | #158 | Good 6.1% |
| Yugoslavians | 73.1 /100 | #159 | Good 6.1% |
| Iraqis | 73.0 /100 | #160 | Good 6.1% |
| Immigrants | Germany | 72.4 /100 | #161 | Good 6.1% |