Immigrants from Somalia vs Immigrants from Philippines Single Mother Households
COMPARE
Immigrants from Somalia
Immigrants from Philippines
Single Mother Households
Single Mother Households Comparison
Immigrants from Somalia
Immigrants from Philippines
7.4%
SINGLE MOTHER HOUSEHOLDS
0.2/ 100
METRIC RATING
262nd/ 347
METRIC RANK
6.1%
SINGLE MOTHER HOUSEHOLDS
78.5/ 100
METRIC RATING
154th/ 347
METRIC RANK
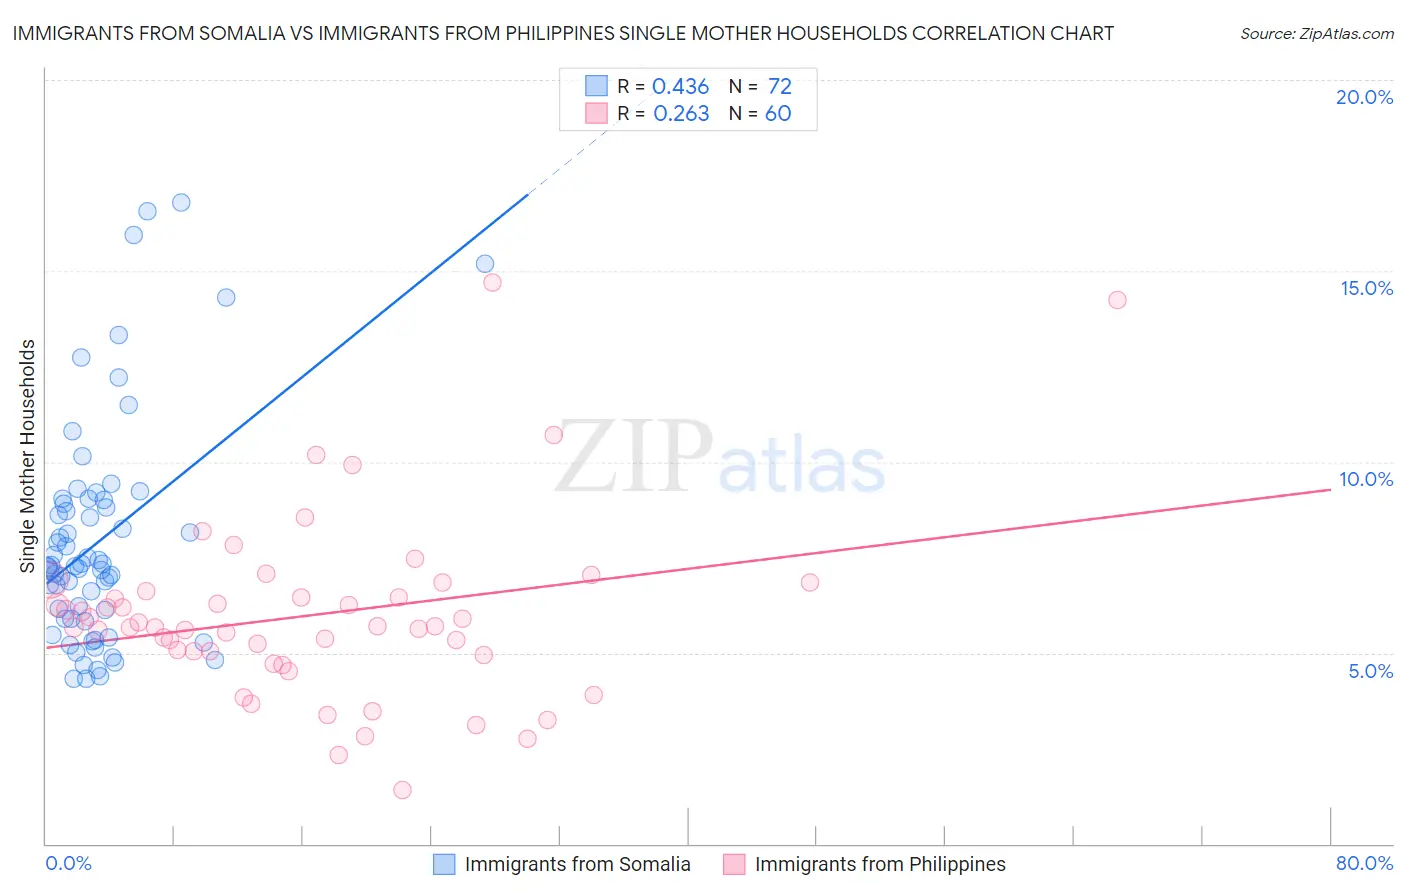
Immigrants from Somalia vs Immigrants from Philippines Single Mother Households Correlation Chart
The statistical analysis conducted on geographies consisting of 92,083,872 people shows a moderate positive correlation between the proportion of Immigrants from Somalia and percentage of single mother households in the United States with a correlation coefficient (R) of 0.436 and weighted average of 7.4%. Similarly, the statistical analysis conducted on geographies consisting of 469,636,643 people shows a weak positive correlation between the proportion of Immigrants from Philippines and percentage of single mother households in the United States with a correlation coefficient (R) of 0.263 and weighted average of 6.1%, a difference of 21.9%.
Single Mother Households Correlation Summary
| Measurement | Immigrants from Somalia | Immigrants from Philippines |
| Minimum | 4.3% | 1.4% |
| Maximum | 16.8% | 14.7% |
| Range | 12.5% | 13.3% |
| Mean | 7.9% | 6.0% |
| Median | 7.3% | 5.7% |
| Interquartile 25% (IQ1) | 5.9% | 5.0% |
| Interquartile 75% (IQ3) | 9.0% | 6.5% |
| Interquartile Range (IQR) | 3.1% | 1.5% |
| Standard Deviation (Sample) | 2.9% | 2.4% |
| Standard Deviation (Population) | 2.9% | 2.4% |
Similar Demographics by Single Mother Households
Demographics Similar to Immigrants from Somalia by Single Mother Households
In terms of single mother households, the demographic groups most similar to Immigrants from Somalia are Immigrants from Nicaragua (7.4%, a difference of 0.15%), Japanese (7.4%, a difference of 0.20%), Immigrants from Zaire (7.4%, a difference of 0.22%), Yaqui (7.4%, a difference of 0.23%), and Immigrants from Yemen (7.4%, a difference of 0.26%).
| Demographics | Rating | Rank | Single Mother Households |
| Mexican American Indians | 0.2 /100 | #255 | Tragic 7.4% |
| Seminole | 0.2 /100 | #256 | Tragic 7.4% |
| Alaska Natives | 0.2 /100 | #257 | Tragic 7.4% |
| Pueblo | 0.2 /100 | #258 | Tragic 7.4% |
| Immigrants | Yemen | 0.2 /100 | #259 | Tragic 7.4% |
| Immigrants | Zaire | 0.2 /100 | #260 | Tragic 7.4% |
| Japanese | 0.2 /100 | #261 | Tragic 7.4% |
| Immigrants | Somalia | 0.2 /100 | #262 | Tragic 7.4% |
| Immigrants | Nicaragua | 0.2 /100 | #263 | Tragic 7.4% |
| Yaqui | 0.1 /100 | #264 | Tragic 7.4% |
| Crow | 0.1 /100 | #265 | Tragic 7.4% |
| Nepalese | 0.1 /100 | #266 | Tragic 7.5% |
| Blackfeet | 0.1 /100 | #267 | Tragic 7.5% |
| Indonesians | 0.1 /100 | #268 | Tragic 7.5% |
| Somalis | 0.1 /100 | #269 | Tragic 7.5% |
Demographics Similar to Immigrants from Philippines by Single Mother Households
In terms of single mother households, the demographic groups most similar to Immigrants from Philippines are Immigrants from Brazil (6.1%, a difference of 0.070%), Pakistani (6.1%, a difference of 0.11%), White/Caucasian (6.1%, a difference of 0.33%), Immigrants from Southern Europe (6.1%, a difference of 0.34%), and Zimbabwean (6.1%, a difference of 0.39%).
| Demographics | Rating | Rank | Single Mother Households |
| Immigrants | Jordan | 82.3 /100 | #147 | Excellent 6.0% |
| Scotch-Irish | 82.0 /100 | #148 | Excellent 6.0% |
| Immigrants | Albania | 81.5 /100 | #149 | Excellent 6.1% |
| Zimbabweans | 80.7 /100 | #150 | Excellent 6.1% |
| Immigrants | Southern Europe | 80.5 /100 | #151 | Excellent 6.1% |
| Pakistanis | 79.2 /100 | #152 | Good 6.1% |
| Immigrants | Brazil | 78.9 /100 | #153 | Good 6.1% |
| Immigrants | Philippines | 78.5 /100 | #154 | Good 6.1% |
| Whites/Caucasians | 76.5 /100 | #155 | Good 6.1% |
| Native Hawaiians | 75.0 /100 | #156 | Good 6.1% |
| Chileans | 74.2 /100 | #157 | Good 6.1% |
| Celtics | 73.3 /100 | #158 | Good 6.1% |
| Yugoslavians | 73.1 /100 | #159 | Good 6.1% |
| Iraqis | 73.0 /100 | #160 | Good 6.1% |
| Immigrants | Germany | 72.4 /100 | #161 | Good 6.1% |