Immigrants from Taiwan vs Immigrants from Philippines Single Mother Households
COMPARE
Immigrants from Taiwan
Immigrants from Philippines
Single Mother Households
Single Mother Households Comparison
Immigrants from Taiwan
Immigrants from Philippines
4.7%
SINGLE MOTHER HOUSEHOLDS
100.0/ 100
METRIC RATING
1st/ 347
METRIC RANK
6.1%
SINGLE MOTHER HOUSEHOLDS
78.5/ 100
METRIC RATING
154th/ 347
METRIC RANK
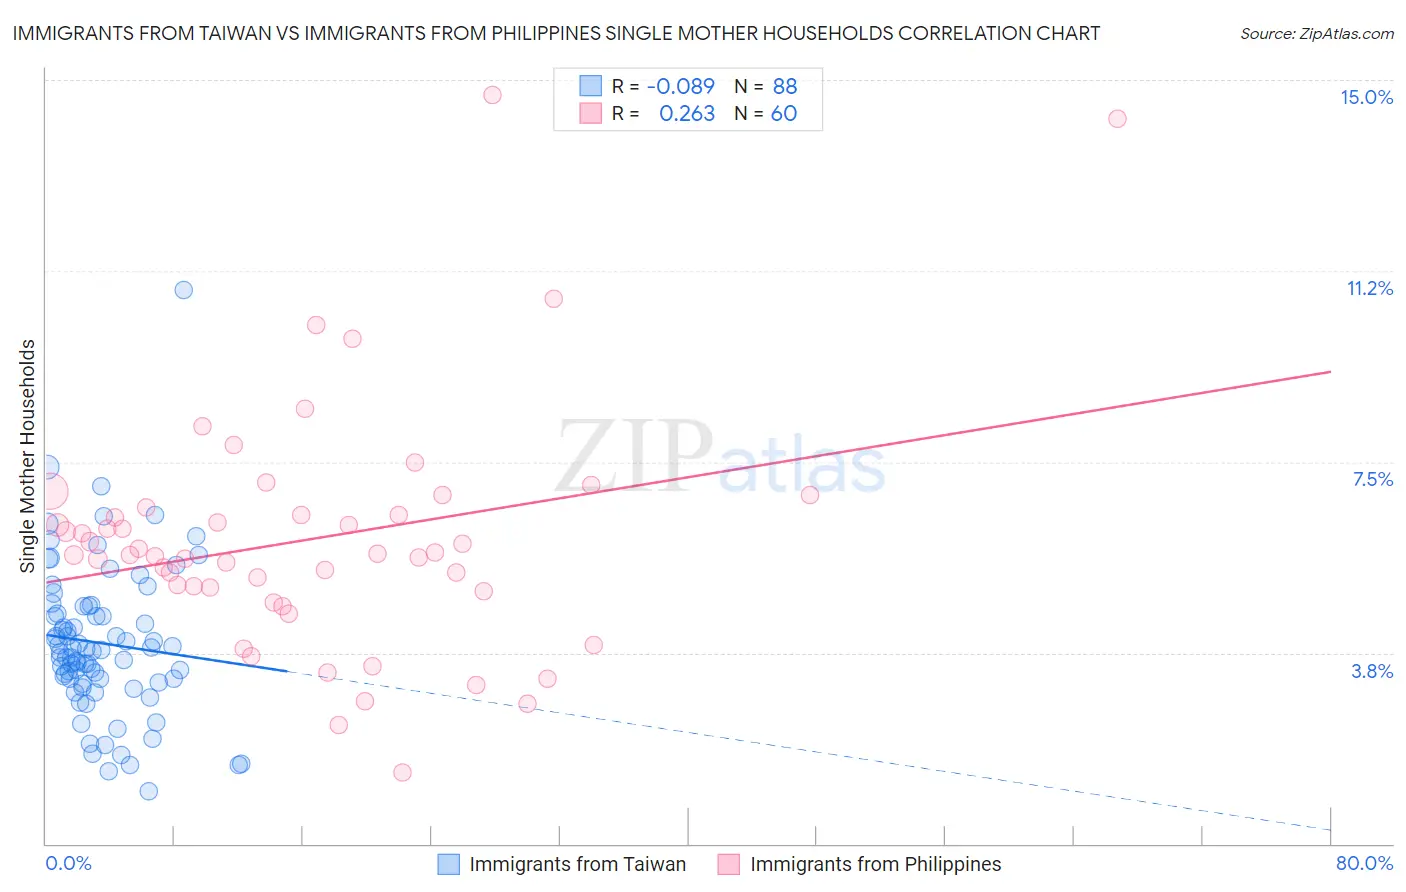
Immigrants from Taiwan vs Immigrants from Philippines Single Mother Households Correlation Chart
The statistical analysis conducted on geographies consisting of 297,635,593 people shows a slight negative correlation between the proportion of Immigrants from Taiwan and percentage of single mother households in the United States with a correlation coefficient (R) of -0.089 and weighted average of 4.7%. Similarly, the statistical analysis conducted on geographies consisting of 469,636,643 people shows a weak positive correlation between the proportion of Immigrants from Philippines and percentage of single mother households in the United States with a correlation coefficient (R) of 0.263 and weighted average of 6.1%, a difference of 30.0%.
Single Mother Households Correlation Summary
| Measurement | Immigrants from Taiwan | Immigrants from Philippines |
| Minimum | 1.0% | 1.4% |
| Maximum | 10.9% | 14.7% |
| Range | 9.8% | 13.3% |
| Mean | 3.9% | 6.0% |
| Median | 3.8% | 5.7% |
| Interquartile 25% (IQ1) | 3.2% | 5.0% |
| Interquartile 75% (IQ3) | 4.6% | 6.5% |
| Interquartile Range (IQR) | 1.4% | 1.5% |
| Standard Deviation (Sample) | 1.5% | 2.4% |
| Standard Deviation (Population) | 1.5% | 2.4% |
Similar Demographics by Single Mother Households
Demographics Similar to Immigrants from Taiwan by Single Mother Households
In terms of single mother households, the demographic groups most similar to Immigrants from Taiwan are Filipino (4.7%, a difference of 0.30%), Immigrants from Iran (4.8%, a difference of 2.6%), Assyrian/Chaldean/Syriac (4.8%, a difference of 2.7%), Immigrants from Hong Kong (4.8%, a difference of 3.3%), and Immigrants from Singapore (5.0%, a difference of 5.9%).
| Demographics | Rating | Rank | Single Mother Households |
| Immigrants | Taiwan | 100.0 /100 | #1 | Exceptional 4.7% |
| Filipinos | 100.0 /100 | #2 | Exceptional 4.7% |
| Immigrants | Iran | 100.0 /100 | #3 | Exceptional 4.8% |
| Assyrians/Chaldeans/Syriacs | 100.0 /100 | #4 | Exceptional 4.8% |
| Immigrants | Hong Kong | 100.0 /100 | #5 | Exceptional 4.8% |
| Immigrants | Singapore | 100.0 /100 | #6 | Exceptional 5.0% |
| Iranians | 100.0 /100 | #7 | Exceptional 5.0% |
| Immigrants | Ireland | 99.9 /100 | #8 | Exceptional 5.0% |
| Okinawans | 99.9 /100 | #9 | Exceptional 5.0% |
| Immigrants | Israel | 99.9 /100 | #10 | Exceptional 5.0% |
| Immigrants | China | 99.9 /100 | #11 | Exceptional 5.1% |
| Cypriots | 99.9 /100 | #12 | Exceptional 5.1% |
| Immigrants | India | 99.9 /100 | #13 | Exceptional 5.1% |
| Immigrants | Australia | 99.9 /100 | #14 | Exceptional 5.1% |
| Immigrants | Eastern Asia | 99.9 /100 | #15 | Exceptional 5.1% |
Demographics Similar to Immigrants from Philippines by Single Mother Households
In terms of single mother households, the demographic groups most similar to Immigrants from Philippines are Immigrants from Brazil (6.1%, a difference of 0.070%), Pakistani (6.1%, a difference of 0.11%), White/Caucasian (6.1%, a difference of 0.33%), Immigrants from Southern Europe (6.1%, a difference of 0.34%), and Zimbabwean (6.1%, a difference of 0.39%).
| Demographics | Rating | Rank | Single Mother Households |
| Immigrants | Jordan | 82.3 /100 | #147 | Excellent 6.0% |
| Scotch-Irish | 82.0 /100 | #148 | Excellent 6.0% |
| Immigrants | Albania | 81.5 /100 | #149 | Excellent 6.1% |
| Zimbabweans | 80.7 /100 | #150 | Excellent 6.1% |
| Immigrants | Southern Europe | 80.5 /100 | #151 | Excellent 6.1% |
| Pakistanis | 79.2 /100 | #152 | Good 6.1% |
| Immigrants | Brazil | 78.9 /100 | #153 | Good 6.1% |
| Immigrants | Philippines | 78.5 /100 | #154 | Good 6.1% |
| Whites/Caucasians | 76.5 /100 | #155 | Good 6.1% |
| Native Hawaiians | 75.0 /100 | #156 | Good 6.1% |
| Chileans | 74.2 /100 | #157 | Good 6.1% |
| Celtics | 73.3 /100 | #158 | Good 6.1% |
| Yugoslavians | 73.1 /100 | #159 | Good 6.1% |
| Iraqis | 73.0 /100 | #160 | Good 6.1% |
| Immigrants | Germany | 72.4 /100 | #161 | Good 6.1% |