Albanian vs Jordanian Married-couple Households
COMPARE
Albanian
Jordanian
Married-couple Households
Married-couple Households Comparison
Albanians
Jordanians
46.1%
MARRIED-COUPLE HOUSEHOLDS
31.1/ 100
METRIC RATING
186th/ 347
METRIC RANK
48.4%
MARRIED-COUPLE HOUSEHOLDS
98.9/ 100
METRIC RATING
66th/ 347
METRIC RANK
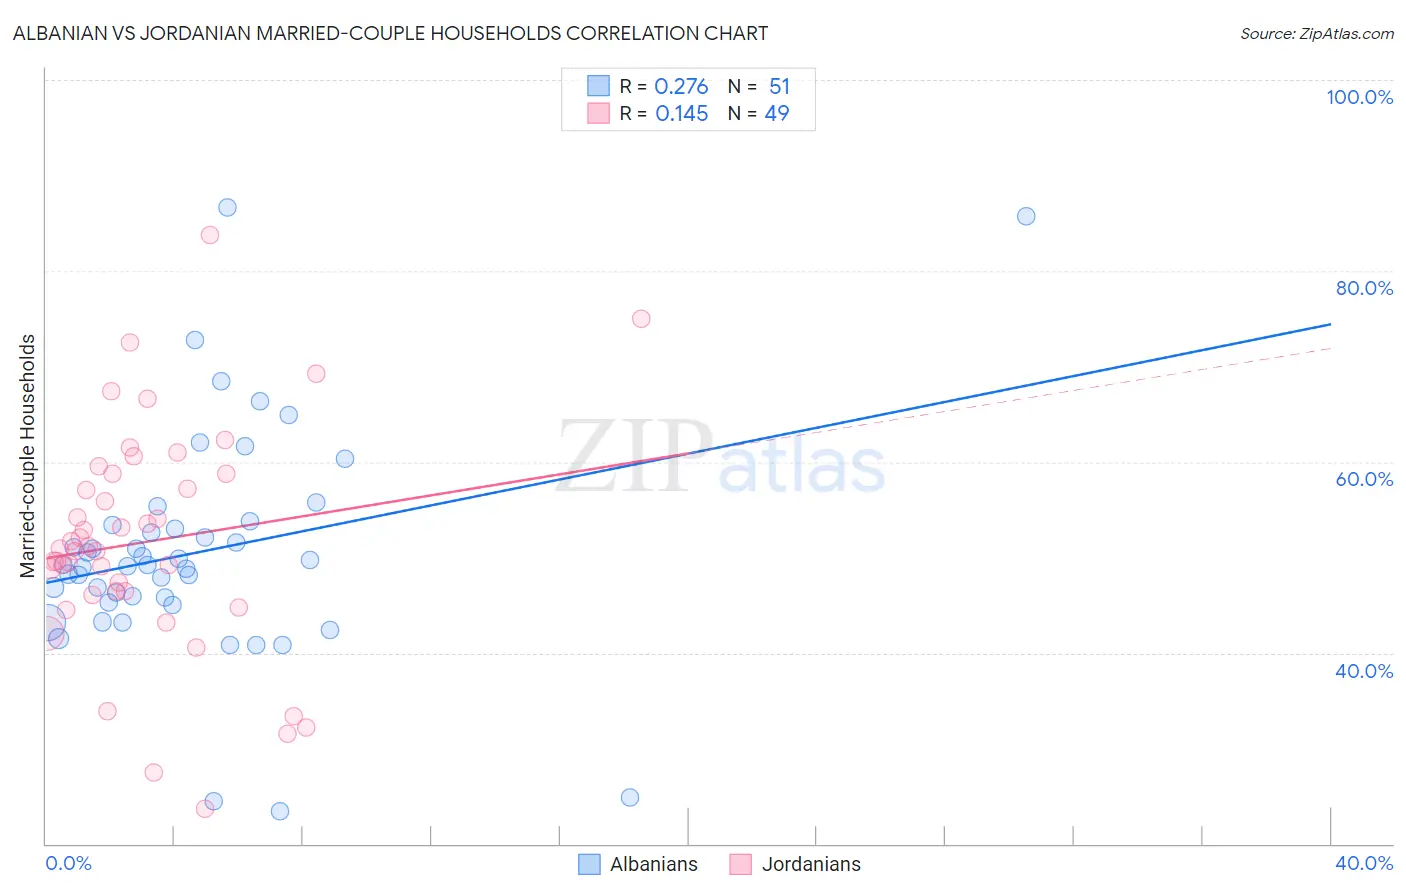
Albanian vs Jordanian Married-couple Households Correlation Chart
The statistical analysis conducted on geographies consisting of 193,184,861 people shows a weak positive correlation between the proportion of Albanians and percentage of married-couple family households in the United States with a correlation coefficient (R) of 0.276 and weighted average of 46.1%. Similarly, the statistical analysis conducted on geographies consisting of 166,389,697 people shows a poor positive correlation between the proportion of Jordanians and percentage of married-couple family households in the United States with a correlation coefficient (R) of 0.145 and weighted average of 48.4%, a difference of 5.0%.
Married-couple Households Correlation Summary
| Measurement | Albanian | Jordanian |
| Minimum | 23.4% | 23.6% |
| Maximum | 86.6% | 83.7% |
| Range | 63.2% | 60.1% |
| Mean | 50.5% | 51.6% |
| Median | 49.1% | 50.9% |
| Interquartile 25% (IQ1) | 45.2% | 46.2% |
| Interquartile 75% (IQ3) | 53.3% | 58.8% |
| Interquartile Range (IQR) | 8.1% | 12.6% |
| Standard Deviation (Sample) | 11.9% | 11.9% |
| Standard Deviation (Population) | 11.8% | 11.7% |
Similar Demographics by Married-couple Households
Demographics Similar to Albanians by Married-couple Households
In terms of married-couple households, the demographic groups most similar to Albanians are Fijian (46.1%, a difference of 0.080%), South American Indian (46.0%, a difference of 0.13%), Brazilian (46.2%, a difference of 0.20%), Immigrants from Latvia (46.0%, a difference of 0.20%), and Immigrants from Switzerland (46.2%, a difference of 0.24%).
| Demographics | Rating | Rank | Married-couple Households |
| Immigrants | Zimbabwe | 43.0 /100 | #179 | Average 46.3% |
| Mongolians | 42.0 /100 | #180 | Average 46.3% |
| Malaysians | 41.8 /100 | #181 | Average 46.3% |
| Yugoslavians | 38.9 /100 | #182 | Fair 46.2% |
| Immigrants | Brazil | 38.3 /100 | #183 | Fair 46.2% |
| Immigrants | Switzerland | 36.9 /100 | #184 | Fair 46.2% |
| Brazilians | 35.9 /100 | #185 | Fair 46.2% |
| Albanians | 31.1 /100 | #186 | Fair 46.1% |
| Fijians | 29.2 /100 | #187 | Fair 46.1% |
| South American Indians | 28.4 /100 | #188 | Fair 46.0% |
| Immigrants | Latvia | 26.9 /100 | #189 | Fair 46.0% |
| Immigrants | Kuwait | 25.6 /100 | #190 | Fair 46.0% |
| Choctaw | 24.9 /100 | #191 | Fair 46.0% |
| Immigrants | Northern Africa | 24.6 /100 | #192 | Fair 46.0% |
| Taiwanese | 23.4 /100 | #193 | Fair 45.9% |
Demographics Similar to Jordanians by Married-couple Households
In terms of married-couple households, the demographic groups most similar to Jordanians are Romanian (48.4%, a difference of 0.0%), Immigrants from South Eastern Asia (48.4%, a difference of 0.020%), Immigrants from China (48.4%, a difference of 0.020%), Immigrants from Canada (48.4%, a difference of 0.030%), and Northern European (48.4%, a difference of 0.040%).
| Demographics | Rating | Rank | Married-couple Households |
| Czechoslovakians | 99.2 /100 | #59 | Exceptional 48.5% |
| Croatians | 99.1 /100 | #60 | Exceptional 48.5% |
| Bulgarians | 99.1 /100 | #61 | Exceptional 48.5% |
| Luxembourgers | 99.1 /100 | #62 | Exceptional 48.5% |
| Basques | 99.0 /100 | #63 | Exceptional 48.4% |
| Northern Europeans | 99.0 /100 | #64 | Exceptional 48.4% |
| Immigrants | Canada | 99.0 /100 | #65 | Exceptional 48.4% |
| Jordanians | 98.9 /100 | #66 | Exceptional 48.4% |
| Romanians | 98.9 /100 | #67 | Exceptional 48.4% |
| Immigrants | South Eastern Asia | 98.9 /100 | #68 | Exceptional 48.4% |
| Immigrants | China | 98.9 /100 | #69 | Exceptional 48.4% |
| Immigrants | North America | 98.9 /100 | #70 | Exceptional 48.4% |
| Laotians | 98.8 /100 | #71 | Exceptional 48.4% |
| Scotch-Irish | 98.6 /100 | #72 | Exceptional 48.3% |
| Immigrants | Singapore | 98.6 /100 | #73 | Exceptional 48.3% |