Alaskan Athabascan vs Scotch-Irish Single Mother Households
COMPARE
Alaskan Athabascan
Scotch-Irish
Single Mother Households
Single Mother Households Comparison
Alaskan Athabascans
Scotch-Irish
7.3%
SINGLE MOTHER HOUSEHOLDS
0.3/ 100
METRIC RATING
252nd/ 347
METRIC RANK
6.0%
SINGLE MOTHER HOUSEHOLDS
82.0/ 100
METRIC RATING
148th/ 347
METRIC RANK
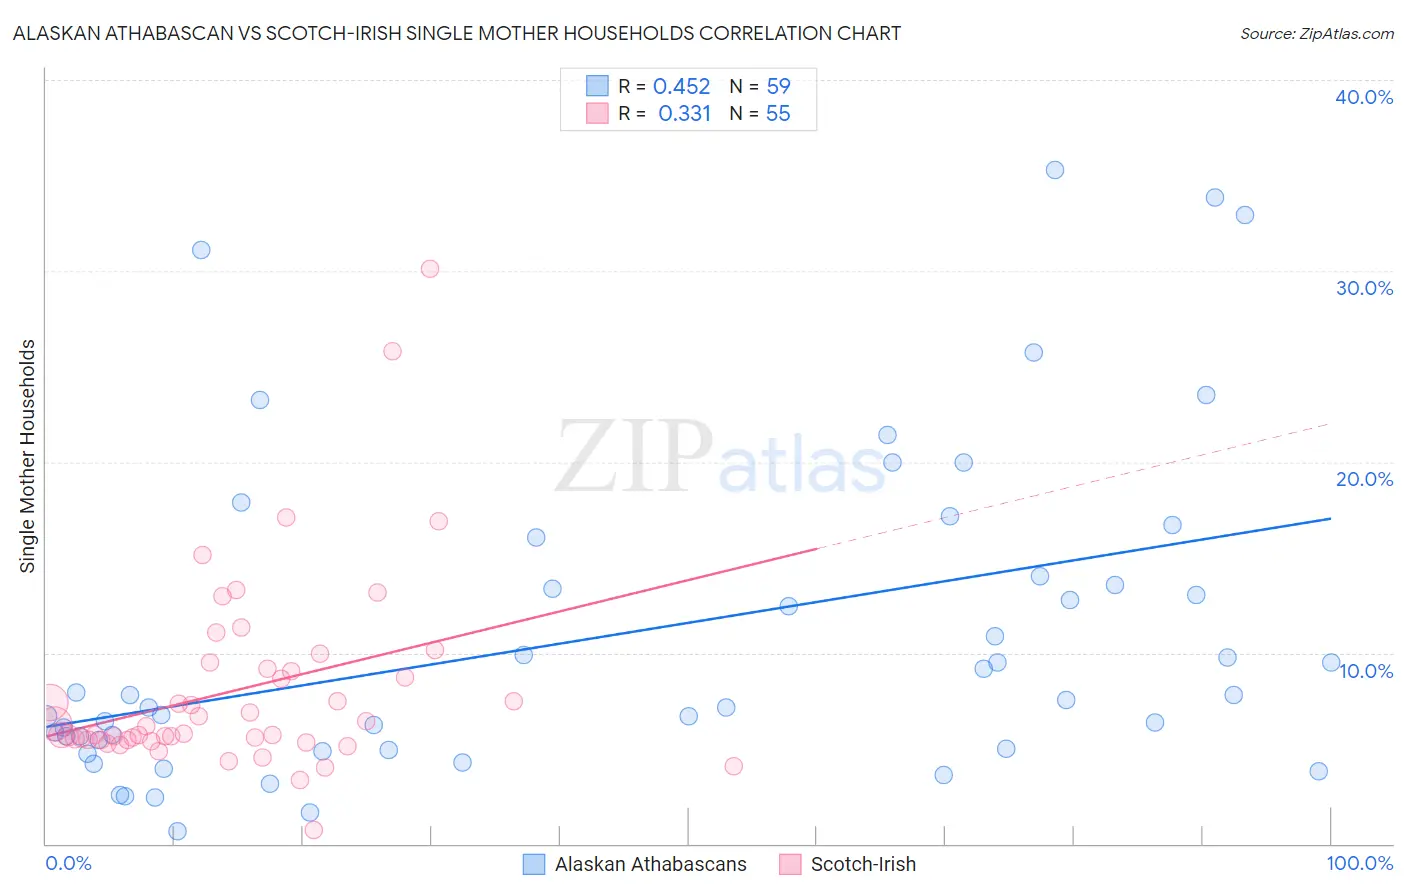
Alaskan Athabascan vs Scotch-Irish Single Mother Households Correlation Chart
The statistical analysis conducted on geographies consisting of 45,772,365 people shows a moderate positive correlation between the proportion of Alaskan Athabascans and percentage of single mother households in the United States with a correlation coefficient (R) of 0.452 and weighted average of 7.3%. Similarly, the statistical analysis conducted on geographies consisting of 544,486,743 people shows a mild positive correlation between the proportion of Scotch-Irish and percentage of single mother households in the United States with a correlation coefficient (R) of 0.331 and weighted average of 6.0%, a difference of 20.8%.
Single Mother Households Correlation Summary
| Measurement | Alaskan Athabascan | Scotch-Irish |
| Minimum | 0.67% | 0.72% |
| Maximum | 35.3% | 30.1% |
| Range | 34.6% | 29.4% |
| Mean | 10.9% | 8.1% |
| Median | 7.5% | 5.8% |
| Interquartile 25% (IQ1) | 5.0% | 5.4% |
| Interquartile 75% (IQ3) | 14.0% | 9.1% |
| Interquartile Range (IQR) | 9.0% | 3.7% |
| Standard Deviation (Sample) | 8.5% | 5.1% |
| Standard Deviation (Population) | 8.4% | 5.1% |
Similar Demographics by Single Mother Households
Demographics Similar to Alaskan Athabascans by Single Mother Households
In terms of single mother households, the demographic groups most similar to Alaskan Athabascans are Malaysian (7.3%, a difference of 0.020%), Immigrants from Africa (7.3%, a difference of 0.37%), Bermudan (7.3%, a difference of 0.38%), Cajun (7.3%, a difference of 0.38%), and Immigrants from Ecuador (7.3%, a difference of 0.44%).
| Demographics | Rating | Rank | Single Mother Households |
| Immigrants | Cambodia | 0.5 /100 | #245 | Tragic 7.2% |
| Nicaraguans | 0.5 /100 | #246 | Tragic 7.2% |
| Dutch West Indians | 0.4 /100 | #247 | Tragic 7.3% |
| Spanish American Indians | 0.4 /100 | #248 | Tragic 7.3% |
| Bermudans | 0.4 /100 | #249 | Tragic 7.3% |
| Immigrants | Africa | 0.4 /100 | #250 | Tragic 7.3% |
| Malaysians | 0.3 /100 | #251 | Tragic 7.3% |
| Alaskan Athabascans | 0.3 /100 | #252 | Tragic 7.3% |
| Cajuns | 0.3 /100 | #253 | Tragic 7.3% |
| Immigrants | Ecuador | 0.3 /100 | #254 | Tragic 7.3% |
| Mexican American Indians | 0.2 /100 | #255 | Tragic 7.4% |
| Seminole | 0.2 /100 | #256 | Tragic 7.4% |
| Alaska Natives | 0.2 /100 | #257 | Tragic 7.4% |
| Pueblo | 0.2 /100 | #258 | Tragic 7.4% |
| Immigrants | Yemen | 0.2 /100 | #259 | Tragic 7.4% |
Demographics Similar to Scotch-Irish by Single Mother Households
In terms of single mother households, the demographic groups most similar to Scotch-Irish are Immigrants from Jordan (6.0%, a difference of 0.050%), Immigrants from Albania (6.1%, a difference of 0.10%), French Canadian (6.0%, a difference of 0.11%), Zimbabwean (6.1%, a difference of 0.24%), and Immigrants from Southern Europe (6.1%, a difference of 0.30%).
| Demographics | Rating | Rank | Single Mother Households |
| Tsimshian | 85.2 /100 | #141 | Excellent 6.0% |
| Immigrants | Egypt | 85.0 /100 | #142 | Excellent 6.0% |
| Immigrants | Iraq | 84.8 /100 | #143 | Excellent 6.0% |
| Koreans | 84.4 /100 | #144 | Excellent 6.0% |
| Arabs | 84.0 /100 | #145 | Excellent 6.0% |
| French Canadians | 82.6 /100 | #146 | Excellent 6.0% |
| Immigrants | Jordan | 82.3 /100 | #147 | Excellent 6.0% |
| Scotch-Irish | 82.0 /100 | #148 | Excellent 6.0% |
| Immigrants | Albania | 81.5 /100 | #149 | Excellent 6.1% |
| Zimbabweans | 80.7 /100 | #150 | Excellent 6.1% |
| Immigrants | Southern Europe | 80.5 /100 | #151 | Excellent 6.1% |
| Pakistanis | 79.2 /100 | #152 | Good 6.1% |
| Immigrants | Brazil | 78.9 /100 | #153 | Good 6.1% |
| Immigrants | Philippines | 78.5 /100 | #154 | Good 6.1% |
| Whites/Caucasians | 76.5 /100 | #155 | Good 6.1% |