Immigrants from Taiwan vs Scotch-Irish Single Mother Households
COMPARE
Immigrants from Taiwan
Scotch-Irish
Single Mother Households
Single Mother Households Comparison
Immigrants from Taiwan
Scotch-Irish
4.7%
SINGLE MOTHER HOUSEHOLDS
100.0/ 100
METRIC RATING
1st/ 347
METRIC RANK
6.0%
SINGLE MOTHER HOUSEHOLDS
82.0/ 100
METRIC RATING
148th/ 347
METRIC RANK
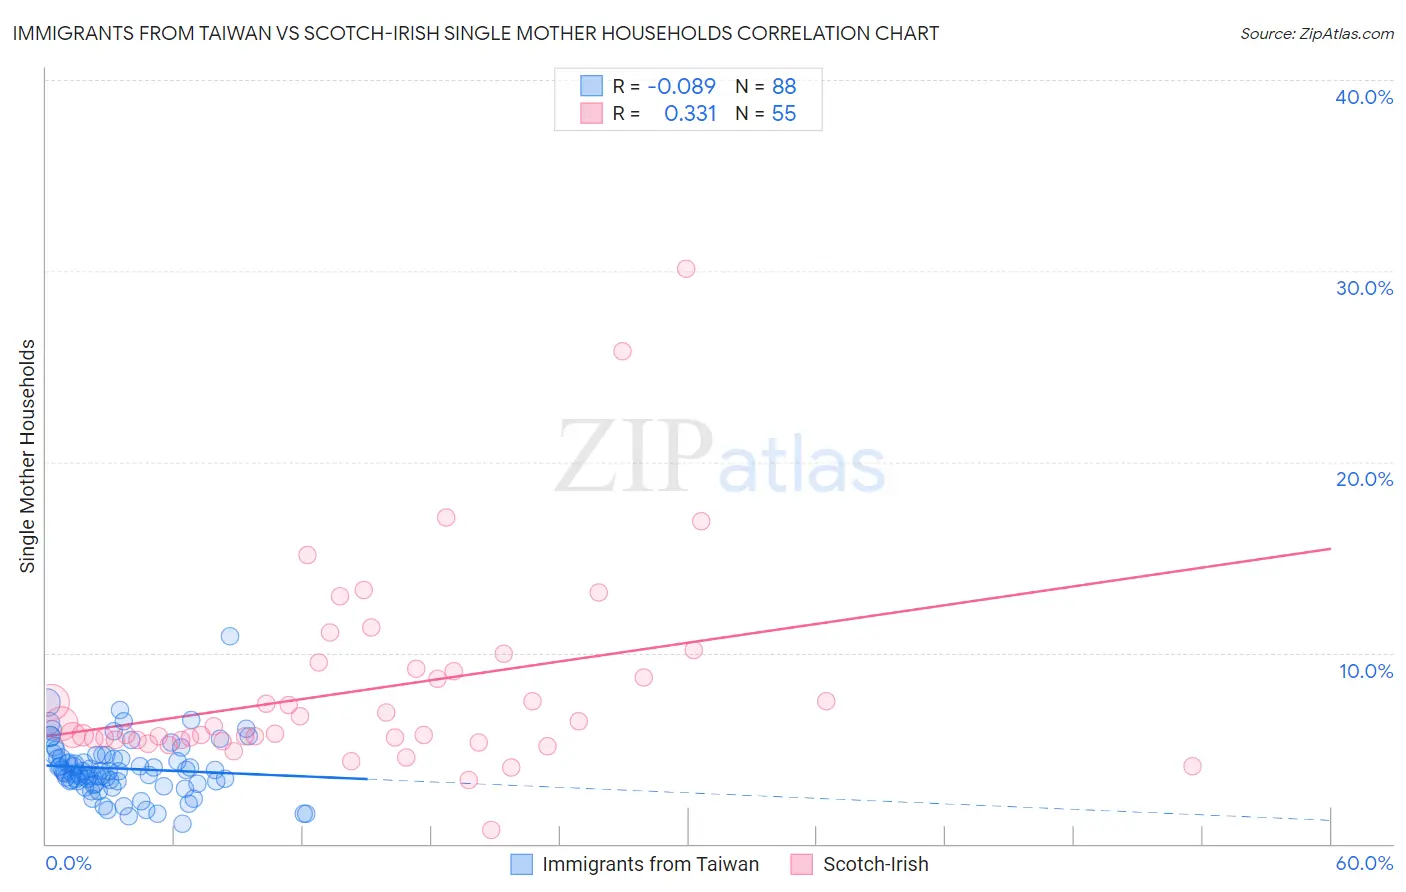
Immigrants from Taiwan vs Scotch-Irish Single Mother Households Correlation Chart
The statistical analysis conducted on geographies consisting of 297,635,593 people shows a slight negative correlation between the proportion of Immigrants from Taiwan and percentage of single mother households in the United States with a correlation coefficient (R) of -0.089 and weighted average of 4.7%. Similarly, the statistical analysis conducted on geographies consisting of 544,486,743 people shows a mild positive correlation between the proportion of Scotch-Irish and percentage of single mother households in the United States with a correlation coefficient (R) of 0.331 and weighted average of 6.0%, a difference of 29.2%.
Single Mother Households Correlation Summary
| Measurement | Immigrants from Taiwan | Scotch-Irish |
| Minimum | 1.0% | 0.72% |
| Maximum | 10.9% | 30.1% |
| Range | 9.8% | 29.4% |
| Mean | 3.9% | 8.1% |
| Median | 3.8% | 5.8% |
| Interquartile 25% (IQ1) | 3.2% | 5.4% |
| Interquartile 75% (IQ3) | 4.6% | 9.1% |
| Interquartile Range (IQR) | 1.4% | 3.7% |
| Standard Deviation (Sample) | 1.5% | 5.1% |
| Standard Deviation (Population) | 1.5% | 5.1% |
Similar Demographics by Single Mother Households
Demographics Similar to Immigrants from Taiwan by Single Mother Households
In terms of single mother households, the demographic groups most similar to Immigrants from Taiwan are Filipino (4.7%, a difference of 0.30%), Immigrants from Iran (4.8%, a difference of 2.6%), Assyrian/Chaldean/Syriac (4.8%, a difference of 2.7%), Immigrants from Hong Kong (4.8%, a difference of 3.3%), and Immigrants from Singapore (5.0%, a difference of 5.9%).
| Demographics | Rating | Rank | Single Mother Households |
| Immigrants | Taiwan | 100.0 /100 | #1 | Exceptional 4.7% |
| Filipinos | 100.0 /100 | #2 | Exceptional 4.7% |
| Immigrants | Iran | 100.0 /100 | #3 | Exceptional 4.8% |
| Assyrians/Chaldeans/Syriacs | 100.0 /100 | #4 | Exceptional 4.8% |
| Immigrants | Hong Kong | 100.0 /100 | #5 | Exceptional 4.8% |
| Immigrants | Singapore | 100.0 /100 | #6 | Exceptional 5.0% |
| Iranians | 100.0 /100 | #7 | Exceptional 5.0% |
| Immigrants | Ireland | 99.9 /100 | #8 | Exceptional 5.0% |
| Okinawans | 99.9 /100 | #9 | Exceptional 5.0% |
| Immigrants | Israel | 99.9 /100 | #10 | Exceptional 5.0% |
| Immigrants | China | 99.9 /100 | #11 | Exceptional 5.1% |
| Cypriots | 99.9 /100 | #12 | Exceptional 5.1% |
| Immigrants | India | 99.9 /100 | #13 | Exceptional 5.1% |
| Immigrants | Australia | 99.9 /100 | #14 | Exceptional 5.1% |
| Immigrants | Eastern Asia | 99.9 /100 | #15 | Exceptional 5.1% |
Demographics Similar to Scotch-Irish by Single Mother Households
In terms of single mother households, the demographic groups most similar to Scotch-Irish are Immigrants from Jordan (6.0%, a difference of 0.050%), Immigrants from Albania (6.1%, a difference of 0.10%), French Canadian (6.0%, a difference of 0.11%), Zimbabwean (6.1%, a difference of 0.24%), and Immigrants from Southern Europe (6.1%, a difference of 0.30%).
| Demographics | Rating | Rank | Single Mother Households |
| Tsimshian | 85.2 /100 | #141 | Excellent 6.0% |
| Immigrants | Egypt | 85.0 /100 | #142 | Excellent 6.0% |
| Immigrants | Iraq | 84.8 /100 | #143 | Excellent 6.0% |
| Koreans | 84.4 /100 | #144 | Excellent 6.0% |
| Arabs | 84.0 /100 | #145 | Excellent 6.0% |
| French Canadians | 82.6 /100 | #146 | Excellent 6.0% |
| Immigrants | Jordan | 82.3 /100 | #147 | Excellent 6.0% |
| Scotch-Irish | 82.0 /100 | #148 | Excellent 6.0% |
| Immigrants | Albania | 81.5 /100 | #149 | Excellent 6.1% |
| Zimbabweans | 80.7 /100 | #150 | Excellent 6.1% |
| Immigrants | Southern Europe | 80.5 /100 | #151 | Excellent 6.1% |
| Pakistanis | 79.2 /100 | #152 | Good 6.1% |
| Immigrants | Brazil | 78.9 /100 | #153 | Good 6.1% |
| Immigrants | Philippines | 78.5 /100 | #154 | Good 6.1% |
| Whites/Caucasians | 76.5 /100 | #155 | Good 6.1% |