Menominee vs Scotch-Irish Single Mother Households
COMPARE
Menominee
Scotch-Irish
Single Mother Households
Single Mother Households Comparison
Menominee
Scotch-Irish
9.2%
SINGLE MOTHER HOUSEHOLDS
0.0/ 100
METRIC RATING
342nd/ 347
METRIC RANK
6.0%
SINGLE MOTHER HOUSEHOLDS
82.0/ 100
METRIC RATING
148th/ 347
METRIC RANK
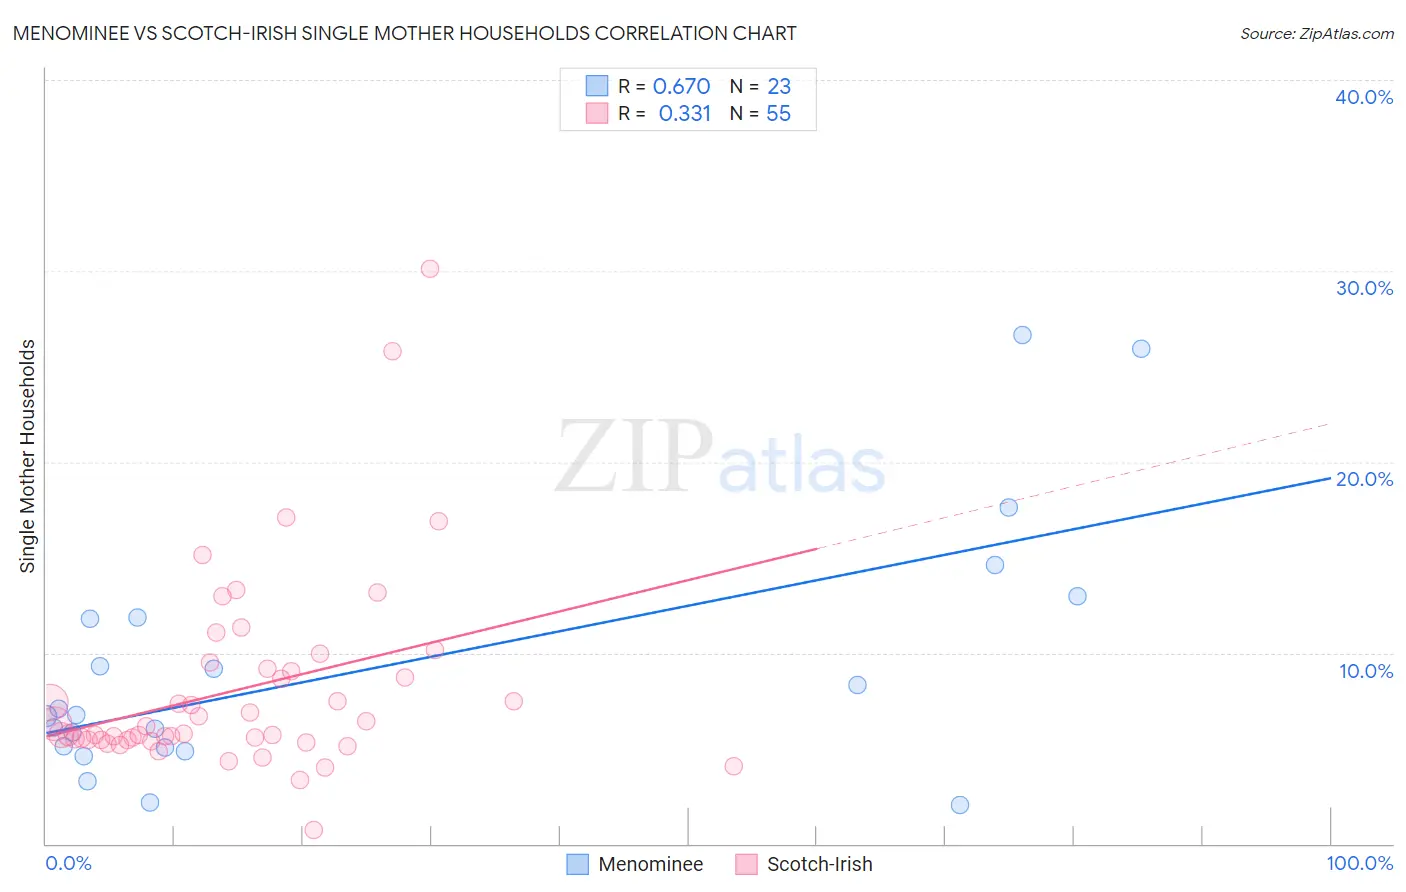
Menominee vs Scotch-Irish Single Mother Households Correlation Chart
The statistical analysis conducted on geographies consisting of 45,774,127 people shows a significant positive correlation between the proportion of Menominee and percentage of single mother households in the United States with a correlation coefficient (R) of 0.670 and weighted average of 9.2%. Similarly, the statistical analysis conducted on geographies consisting of 544,486,743 people shows a mild positive correlation between the proportion of Scotch-Irish and percentage of single mother households in the United States with a correlation coefficient (R) of 0.331 and weighted average of 6.0%, a difference of 51.5%.
Single Mother Households Correlation Summary
| Measurement | Menominee | Scotch-Irish |
| Minimum | 2.0% | 0.72% |
| Maximum | 26.7% | 30.1% |
| Range | 24.6% | 29.4% |
| Mean | 9.3% | 8.1% |
| Median | 6.7% | 5.8% |
| Interquartile 25% (IQ1) | 5.0% | 5.4% |
| Interquartile 75% (IQ3) | 11.9% | 9.1% |
| Interquartile Range (IQR) | 6.9% | 3.7% |
| Standard Deviation (Sample) | 6.6% | 5.1% |
| Standard Deviation (Population) | 6.5% | 5.1% |
Similar Demographics by Single Mother Households
Demographics Similar to Menominee by Single Mother Households
In terms of single mother households, the demographic groups most similar to Menominee are Dominican (9.2%, a difference of 0.21%), Tohono O'odham (9.1%, a difference of 0.32%), Lumbee (9.1%, a difference of 0.68%), Black/African American (9.0%, a difference of 1.9%), and Cape Verdean (8.9%, a difference of 3.5%).
| Demographics | Rating | Rank | Single Mother Households |
| Liberians | 0.0 /100 | #333 | Tragic 8.6% |
| Immigrants | Liberia | 0.0 /100 | #334 | Tragic 8.7% |
| Immigrants | Dominica | 0.0 /100 | #335 | Tragic 8.7% |
| Puerto Ricans | 0.0 /100 | #336 | Tragic 8.7% |
| Navajo | 0.0 /100 | #337 | Tragic 8.8% |
| Cape Verdeans | 0.0 /100 | #338 | Tragic 8.9% |
| Blacks/African Americans | 0.0 /100 | #339 | Tragic 9.0% |
| Lumbee | 0.0 /100 | #340 | Tragic 9.1% |
| Tohono O'odham | 0.0 /100 | #341 | Tragic 9.1% |
| Menominee | 0.0 /100 | #342 | Tragic 9.2% |
| Dominicans | 0.0 /100 | #343 | Tragic 9.2% |
| Immigrants | Dominican Republic | 0.0 /100 | #344 | Tragic 9.5% |
| Immigrants | Cabo Verde | 0.0 /100 | #345 | Tragic 9.6% |
| Yuman | 0.0 /100 | #346 | Tragic 9.6% |
| Yup'ik | 0.0 /100 | #347 | Tragic 10.0% |
Demographics Similar to Scotch-Irish by Single Mother Households
In terms of single mother households, the demographic groups most similar to Scotch-Irish are Immigrants from Jordan (6.0%, a difference of 0.050%), Immigrants from Albania (6.1%, a difference of 0.10%), French Canadian (6.0%, a difference of 0.11%), Zimbabwean (6.1%, a difference of 0.24%), and Immigrants from Southern Europe (6.1%, a difference of 0.30%).
| Demographics | Rating | Rank | Single Mother Households |
| Tsimshian | 85.2 /100 | #141 | Excellent 6.0% |
| Immigrants | Egypt | 85.0 /100 | #142 | Excellent 6.0% |
| Immigrants | Iraq | 84.8 /100 | #143 | Excellent 6.0% |
| Koreans | 84.4 /100 | #144 | Excellent 6.0% |
| Arabs | 84.0 /100 | #145 | Excellent 6.0% |
| French Canadians | 82.6 /100 | #146 | Excellent 6.0% |
| Immigrants | Jordan | 82.3 /100 | #147 | Excellent 6.0% |
| Scotch-Irish | 82.0 /100 | #148 | Excellent 6.0% |
| Immigrants | Albania | 81.5 /100 | #149 | Excellent 6.1% |
| Zimbabweans | 80.7 /100 | #150 | Excellent 6.1% |
| Immigrants | Southern Europe | 80.5 /100 | #151 | Excellent 6.1% |
| Pakistanis | 79.2 /100 | #152 | Good 6.1% |
| Immigrants | Brazil | 78.9 /100 | #153 | Good 6.1% |
| Immigrants | Philippines | 78.5 /100 | #154 | Good 6.1% |
| Whites/Caucasians | 76.5 /100 | #155 | Good 6.1% |