Alaskan Athabascan vs Immigrants from Iran Single Mother Households
COMPARE
Alaskan Athabascan
Immigrants from Iran
Single Mother Households
Single Mother Households Comparison
Alaskan Athabascans
Immigrants from Iran
7.3%
SINGLE MOTHER HOUSEHOLDS
0.3/ 100
METRIC RATING
252nd/ 347
METRIC RANK
4.8%
SINGLE MOTHER HOUSEHOLDS
100.0/ 100
METRIC RATING
3rd/ 347
METRIC RANK
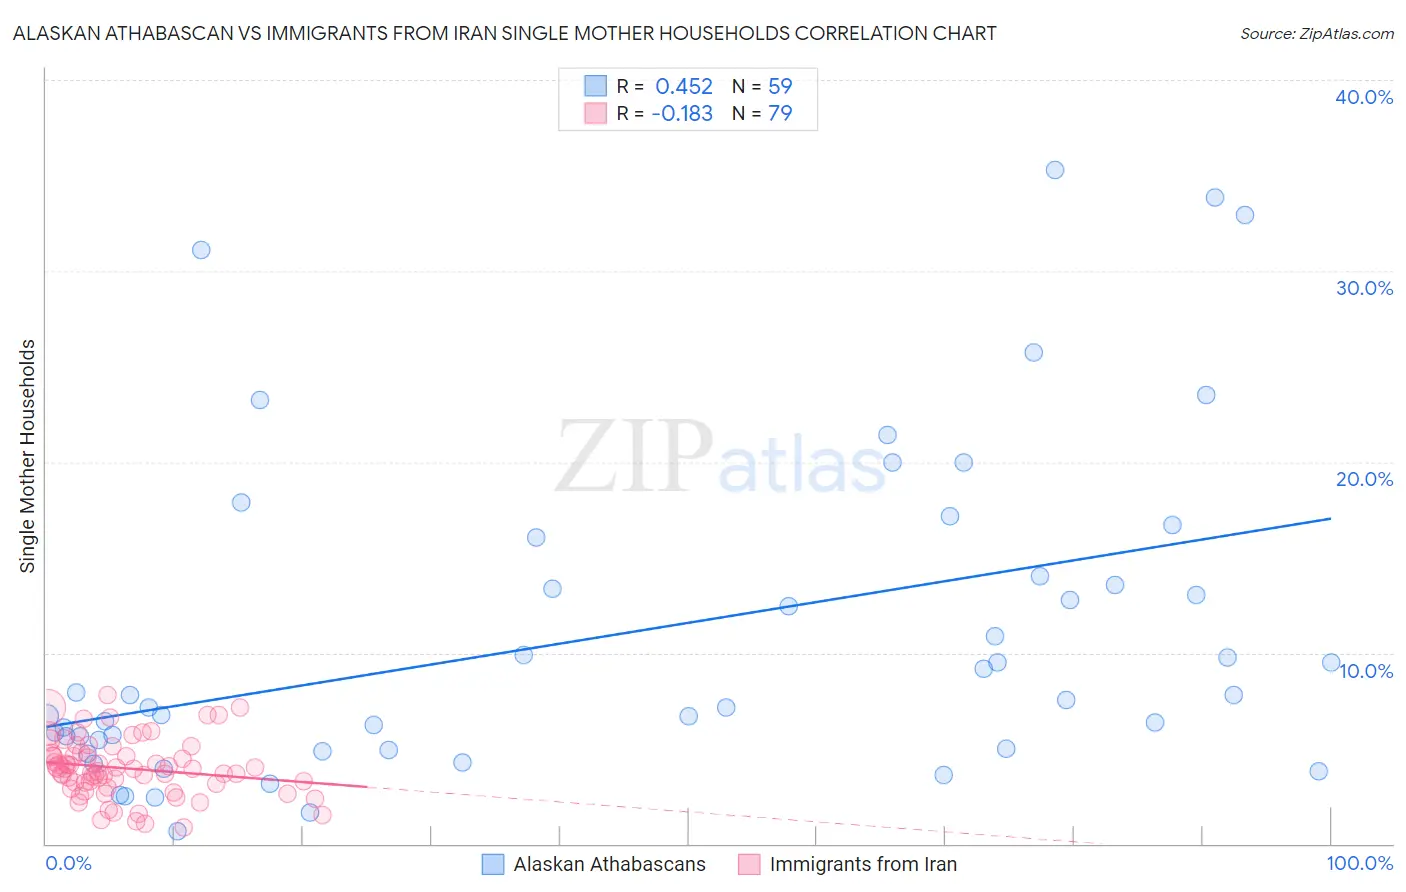
Alaskan Athabascan vs Immigrants from Iran Single Mother Households Correlation Chart
The statistical analysis conducted on geographies consisting of 45,772,365 people shows a moderate positive correlation between the proportion of Alaskan Athabascans and percentage of single mother households in the United States with a correlation coefficient (R) of 0.452 and weighted average of 7.3%. Similarly, the statistical analysis conducted on geographies consisting of 279,447,711 people shows a poor negative correlation between the proportion of Immigrants from Iran and percentage of single mother households in the United States with a correlation coefficient (R) of -0.183 and weighted average of 4.8%, a difference of 52.1%.
Single Mother Households Correlation Summary
| Measurement | Alaskan Athabascan | Immigrants from Iran |
| Minimum | 0.67% | 0.87% |
| Maximum | 35.3% | 7.8% |
| Range | 34.6% | 6.9% |
| Mean | 10.9% | 4.0% |
| Median | 7.5% | 3.9% |
| Interquartile 25% (IQ1) | 5.0% | 3.2% |
| Interquartile 75% (IQ3) | 14.0% | 4.7% |
| Interquartile Range (IQR) | 9.0% | 1.5% |
| Standard Deviation (Sample) | 8.5% | 1.5% |
| Standard Deviation (Population) | 8.4% | 1.5% |
Similar Demographics by Single Mother Households
Demographics Similar to Alaskan Athabascans by Single Mother Households
In terms of single mother households, the demographic groups most similar to Alaskan Athabascans are Malaysian (7.3%, a difference of 0.020%), Immigrants from Africa (7.3%, a difference of 0.37%), Bermudan (7.3%, a difference of 0.38%), Cajun (7.3%, a difference of 0.38%), and Immigrants from Ecuador (7.3%, a difference of 0.44%).
| Demographics | Rating | Rank | Single Mother Households |
| Immigrants | Cambodia | 0.5 /100 | #245 | Tragic 7.2% |
| Nicaraguans | 0.5 /100 | #246 | Tragic 7.2% |
| Dutch West Indians | 0.4 /100 | #247 | Tragic 7.3% |
| Spanish American Indians | 0.4 /100 | #248 | Tragic 7.3% |
| Bermudans | 0.4 /100 | #249 | Tragic 7.3% |
| Immigrants | Africa | 0.4 /100 | #250 | Tragic 7.3% |
| Malaysians | 0.3 /100 | #251 | Tragic 7.3% |
| Alaskan Athabascans | 0.3 /100 | #252 | Tragic 7.3% |
| Cajuns | 0.3 /100 | #253 | Tragic 7.3% |
| Immigrants | Ecuador | 0.3 /100 | #254 | Tragic 7.3% |
| Mexican American Indians | 0.2 /100 | #255 | Tragic 7.4% |
| Seminole | 0.2 /100 | #256 | Tragic 7.4% |
| Alaska Natives | 0.2 /100 | #257 | Tragic 7.4% |
| Pueblo | 0.2 /100 | #258 | Tragic 7.4% |
| Immigrants | Yemen | 0.2 /100 | #259 | Tragic 7.4% |
Demographics Similar to Immigrants from Iran by Single Mother Households
In terms of single mother households, the demographic groups most similar to Immigrants from Iran are Assyrian/Chaldean/Syriac (4.8%, a difference of 0.080%), Immigrants from Hong Kong (4.8%, a difference of 0.60%), Filipino (4.7%, a difference of 2.3%), Immigrants from Taiwan (4.7%, a difference of 2.6%), and Immigrants from Singapore (5.0%, a difference of 3.2%).
| Demographics | Rating | Rank | Single Mother Households |
| Immigrants | Taiwan | 100.0 /100 | #1 | Exceptional 4.7% |
| Filipinos | 100.0 /100 | #2 | Exceptional 4.7% |
| Immigrants | Iran | 100.0 /100 | #3 | Exceptional 4.8% |
| Assyrians/Chaldeans/Syriacs | 100.0 /100 | #4 | Exceptional 4.8% |
| Immigrants | Hong Kong | 100.0 /100 | #5 | Exceptional 4.8% |
| Immigrants | Singapore | 100.0 /100 | #6 | Exceptional 5.0% |
| Iranians | 100.0 /100 | #7 | Exceptional 5.0% |
| Immigrants | Ireland | 99.9 /100 | #8 | Exceptional 5.0% |
| Okinawans | 99.9 /100 | #9 | Exceptional 5.0% |
| Immigrants | Israel | 99.9 /100 | #10 | Exceptional 5.0% |
| Immigrants | China | 99.9 /100 | #11 | Exceptional 5.1% |
| Cypriots | 99.9 /100 | #12 | Exceptional 5.1% |
| Immigrants | India | 99.9 /100 | #13 | Exceptional 5.1% |
| Immigrants | Australia | 99.9 /100 | #14 | Exceptional 5.1% |
| Immigrants | Eastern Asia | 99.9 /100 | #15 | Exceptional 5.1% |