Yaqui vs Scotch-Irish Single Mother Households
COMPARE
Yaqui
Scotch-Irish
Single Mother Households
Single Mother Households Comparison
Yaqui
Scotch-Irish
7.4%
SINGLE MOTHER HOUSEHOLDS
0.1/ 100
METRIC RATING
264th/ 347
METRIC RANK
6.0%
SINGLE MOTHER HOUSEHOLDS
82.0/ 100
METRIC RATING
148th/ 347
METRIC RANK
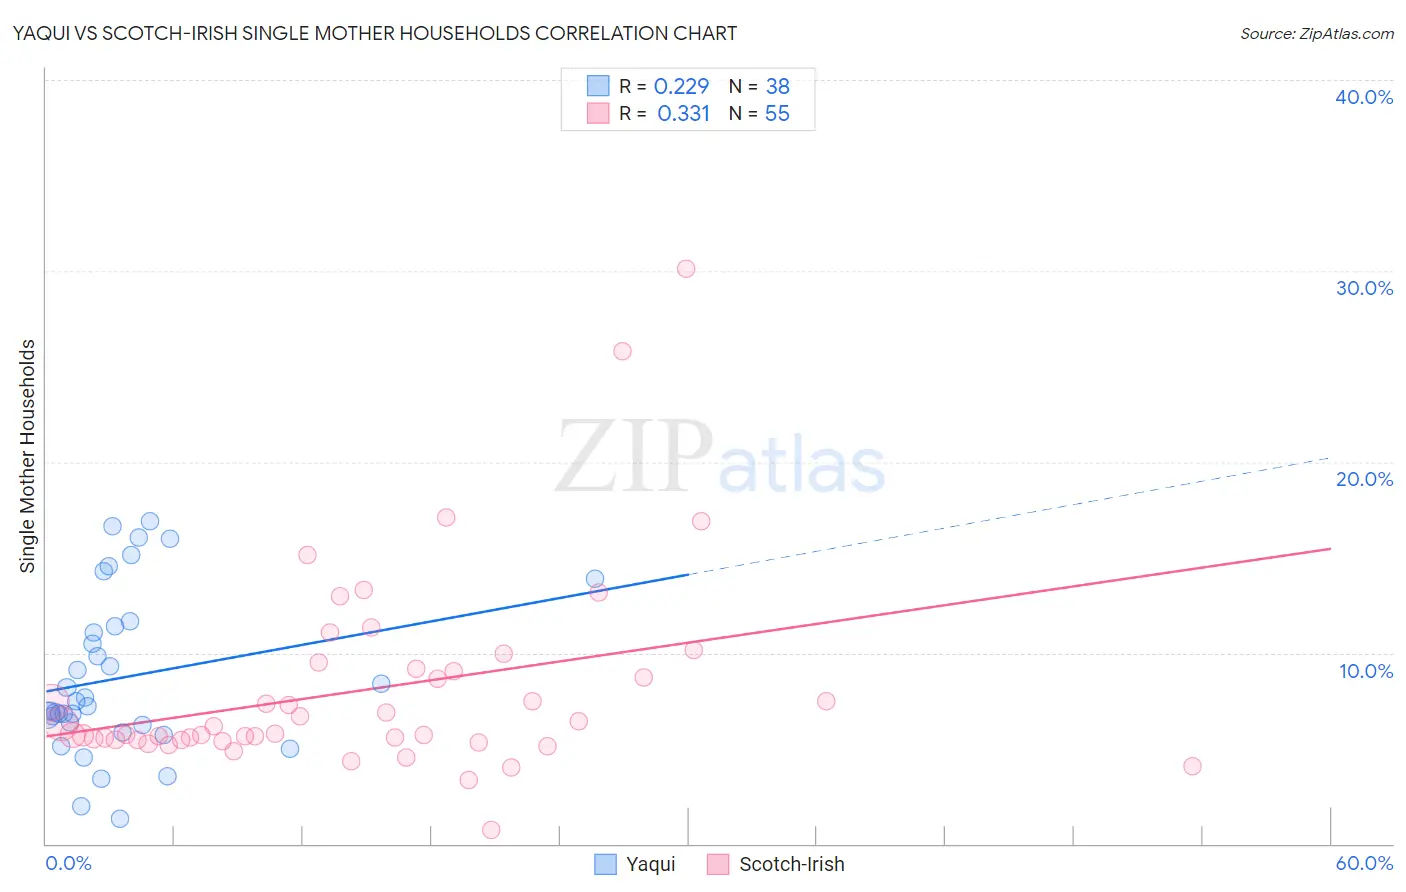
Yaqui vs Scotch-Irish Single Mother Households Correlation Chart
The statistical analysis conducted on geographies consisting of 107,663,122 people shows a weak positive correlation between the proportion of Yaqui and percentage of single mother households in the United States with a correlation coefficient (R) of 0.229 and weighted average of 7.4%. Similarly, the statistical analysis conducted on geographies consisting of 544,486,743 people shows a mild positive correlation between the proportion of Scotch-Irish and percentage of single mother households in the United States with a correlation coefficient (R) of 0.331 and weighted average of 6.0%, a difference of 22.9%.
Single Mother Households Correlation Summary
| Measurement | Yaqui | Scotch-Irish |
| Minimum | 1.3% | 0.72% |
| Maximum | 16.9% | 30.1% |
| Range | 15.6% | 29.4% |
| Mean | 8.7% | 8.1% |
| Median | 7.3% | 5.8% |
| Interquartile 25% (IQ1) | 6.2% | 5.4% |
| Interquartile 75% (IQ3) | 11.4% | 9.1% |
| Interquartile Range (IQR) | 5.2% | 3.7% |
| Standard Deviation (Sample) | 4.2% | 5.1% |
| Standard Deviation (Population) | 4.2% | 5.1% |
Similar Demographics by Single Mother Households
Demographics Similar to Yaqui by Single Mother Households
In terms of single mother households, the demographic groups most similar to Yaqui are Immigrants from Nicaragua (7.4%, a difference of 0.080%), Crow (7.4%, a difference of 0.18%), Immigrants from Somalia (7.4%, a difference of 0.23%), Nepalese (7.5%, a difference of 0.27%), and Japanese (7.4%, a difference of 0.43%).
| Demographics | Rating | Rank | Single Mother Households |
| Alaska Natives | 0.2 /100 | #257 | Tragic 7.4% |
| Pueblo | 0.2 /100 | #258 | Tragic 7.4% |
| Immigrants | Yemen | 0.2 /100 | #259 | Tragic 7.4% |
| Immigrants | Zaire | 0.2 /100 | #260 | Tragic 7.4% |
| Japanese | 0.2 /100 | #261 | Tragic 7.4% |
| Immigrants | Somalia | 0.2 /100 | #262 | Tragic 7.4% |
| Immigrants | Nicaragua | 0.2 /100 | #263 | Tragic 7.4% |
| Yaqui | 0.1 /100 | #264 | Tragic 7.4% |
| Crow | 0.1 /100 | #265 | Tragic 7.4% |
| Nepalese | 0.1 /100 | #266 | Tragic 7.5% |
| Blackfeet | 0.1 /100 | #267 | Tragic 7.5% |
| Indonesians | 0.1 /100 | #268 | Tragic 7.5% |
| Somalis | 0.1 /100 | #269 | Tragic 7.5% |
| Immigrants | Cuba | 0.1 /100 | #270 | Tragic 7.5% |
| Salvadorans | 0.1 /100 | #271 | Tragic 7.5% |
Demographics Similar to Scotch-Irish by Single Mother Households
In terms of single mother households, the demographic groups most similar to Scotch-Irish are Immigrants from Jordan (6.0%, a difference of 0.050%), Immigrants from Albania (6.1%, a difference of 0.10%), French Canadian (6.0%, a difference of 0.11%), Zimbabwean (6.1%, a difference of 0.24%), and Immigrants from Southern Europe (6.1%, a difference of 0.30%).
| Demographics | Rating | Rank | Single Mother Households |
| Tsimshian | 85.2 /100 | #141 | Excellent 6.0% |
| Immigrants | Egypt | 85.0 /100 | #142 | Excellent 6.0% |
| Immigrants | Iraq | 84.8 /100 | #143 | Excellent 6.0% |
| Koreans | 84.4 /100 | #144 | Excellent 6.0% |
| Arabs | 84.0 /100 | #145 | Excellent 6.0% |
| French Canadians | 82.6 /100 | #146 | Excellent 6.0% |
| Immigrants | Jordan | 82.3 /100 | #147 | Excellent 6.0% |
| Scotch-Irish | 82.0 /100 | #148 | Excellent 6.0% |
| Immigrants | Albania | 81.5 /100 | #149 | Excellent 6.1% |
| Zimbabweans | 80.7 /100 | #150 | Excellent 6.1% |
| Immigrants | Southern Europe | 80.5 /100 | #151 | Excellent 6.1% |
| Pakistanis | 79.2 /100 | #152 | Good 6.1% |
| Immigrants | Brazil | 78.9 /100 | #153 | Good 6.1% |
| Immigrants | Philippines | 78.5 /100 | #154 | Good 6.1% |
| Whites/Caucasians | 76.5 /100 | #155 | Good 6.1% |