Alaskan Athabascan vs Japanese Single Mother Households
COMPARE
Alaskan Athabascan
Japanese
Single Mother Households
Single Mother Households Comparison
Alaskan Athabascans
Japanese
7.3%
SINGLE MOTHER HOUSEHOLDS
0.3/ 100
METRIC RATING
252nd/ 347
METRIC RANK
7.4%
SINGLE MOTHER HOUSEHOLDS
0.2/ 100
METRIC RATING
261st/ 347
METRIC RANK
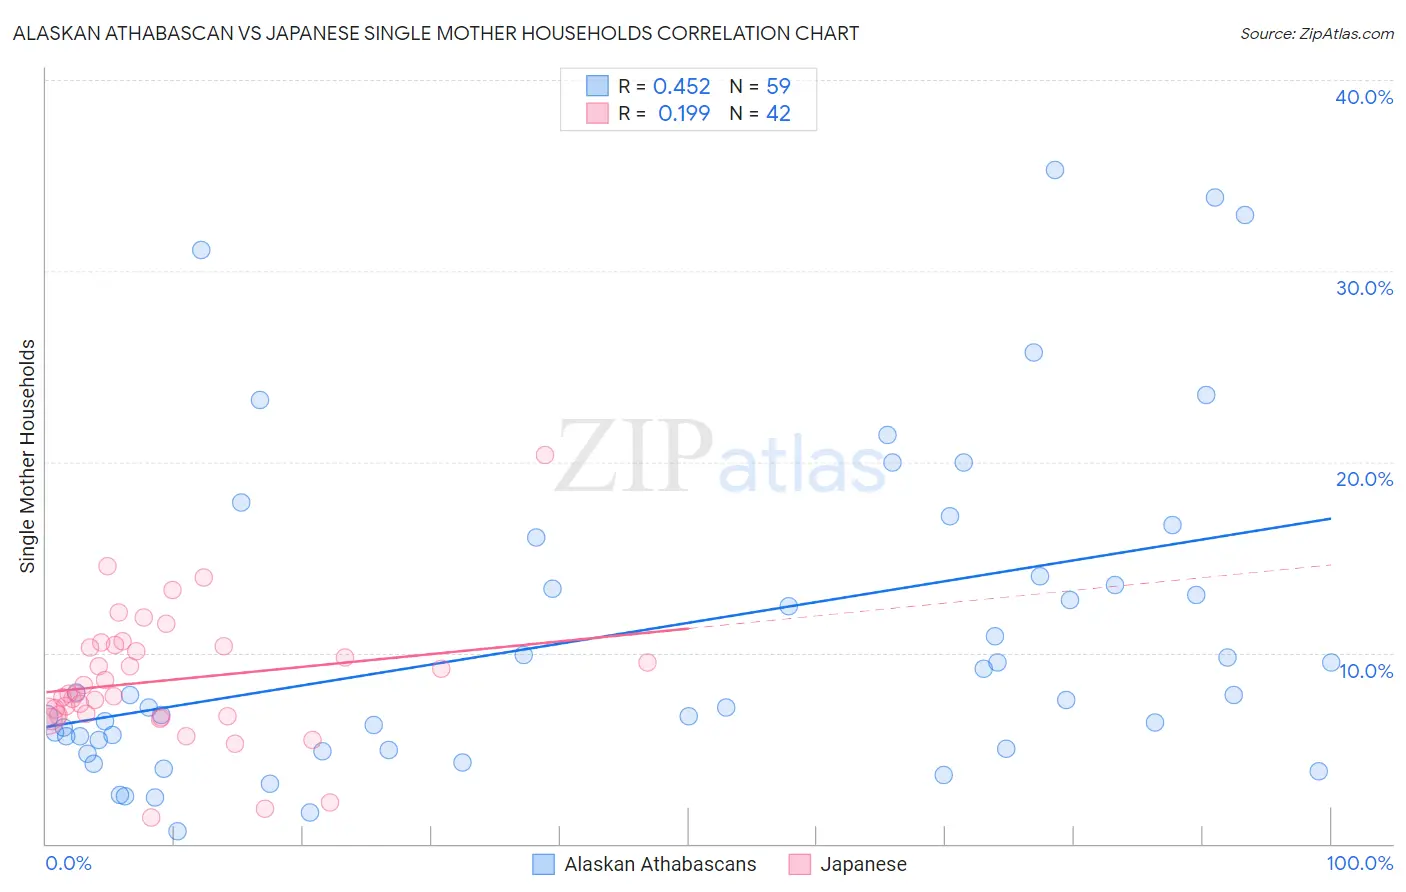
Alaskan Athabascan vs Japanese Single Mother Households Correlation Chart
The statistical analysis conducted on geographies consisting of 45,772,365 people shows a moderate positive correlation between the proportion of Alaskan Athabascans and percentage of single mother households in the United States with a correlation coefficient (R) of 0.452 and weighted average of 7.3%. Similarly, the statistical analysis conducted on geographies consisting of 248,925,725 people shows a poor positive correlation between the proportion of Japanese and percentage of single mother households in the United States with a correlation coefficient (R) of 0.199 and weighted average of 7.4%, a difference of 1.3%.
Single Mother Households Correlation Summary
| Measurement | Alaskan Athabascan | Japanese |
| Minimum | 0.67% | 1.3% |
| Maximum | 35.3% | 20.4% |
| Range | 34.6% | 19.0% |
| Mean | 10.9% | 8.6% |
| Median | 7.5% | 7.8% |
| Interquartile 25% (IQ1) | 5.0% | 6.7% |
| Interquartile 75% (IQ3) | 14.0% | 10.3% |
| Interquartile Range (IQR) | 9.0% | 3.6% |
| Standard Deviation (Sample) | 8.5% | 3.4% |
| Standard Deviation (Population) | 8.4% | 3.4% |
Demographics Similar to Alaskan Athabascans and Japanese by Single Mother Households
In terms of single mother households, the demographic groups most similar to Alaskan Athabascans are Malaysian (7.3%, a difference of 0.020%), Immigrants from Africa (7.3%, a difference of 0.37%), Bermudan (7.3%, a difference of 0.38%), Cajun (7.3%, a difference of 0.38%), and Immigrants from Ecuador (7.3%, a difference of 0.44%). Similarly, the demographic groups most similar to Japanese are Immigrants from Zaire (7.4%, a difference of 0.020%), Immigrants from Yemen (7.4%, a difference of 0.060%), Pueblo (7.4%, a difference of 0.080%), Alaska Native (7.4%, a difference of 0.10%), and Seminole (7.4%, a difference of 0.15%).
| Demographics | Rating | Rank | Single Mother Households |
| Nicaraguans | 0.5 /100 | #246 | Tragic 7.2% |
| Dutch West Indians | 0.4 /100 | #247 | Tragic 7.3% |
| Spanish American Indians | 0.4 /100 | #248 | Tragic 7.3% |
| Bermudans | 0.4 /100 | #249 | Tragic 7.3% |
| Immigrants | Africa | 0.4 /100 | #250 | Tragic 7.3% |
| Malaysians | 0.3 /100 | #251 | Tragic 7.3% |
| Alaskan Athabascans | 0.3 /100 | #252 | Tragic 7.3% |
| Cajuns | 0.3 /100 | #253 | Tragic 7.3% |
| Immigrants | Ecuador | 0.3 /100 | #254 | Tragic 7.3% |
| Mexican American Indians | 0.2 /100 | #255 | Tragic 7.4% |
| Seminole | 0.2 /100 | #256 | Tragic 7.4% |
| Alaska Natives | 0.2 /100 | #257 | Tragic 7.4% |
| Pueblo | 0.2 /100 | #258 | Tragic 7.4% |
| Immigrants | Yemen | 0.2 /100 | #259 | Tragic 7.4% |
| Immigrants | Zaire | 0.2 /100 | #260 | Tragic 7.4% |
| Japanese | 0.2 /100 | #261 | Tragic 7.4% |
| Immigrants | Somalia | 0.2 /100 | #262 | Tragic 7.4% |
| Immigrants | Nicaragua | 0.2 /100 | #263 | Tragic 7.4% |
| Yaqui | 0.1 /100 | #264 | Tragic 7.4% |
| Crow | 0.1 /100 | #265 | Tragic 7.4% |
| Nepalese | 0.1 /100 | #266 | Tragic 7.5% |