Alaskan Athabascan vs Immigrants from Fiji Single Mother Households
COMPARE
Alaskan Athabascan
Immigrants from Fiji
Single Mother Households
Single Mother Households Comparison
Alaskan Athabascans
Immigrants from Fiji
7.3%
SINGLE MOTHER HOUSEHOLDS
0.3/ 100
METRIC RATING
252nd/ 347
METRIC RANK
6.7%
SINGLE MOTHER HOUSEHOLDS
11.9/ 100
METRIC RATING
204th/ 347
METRIC RANK
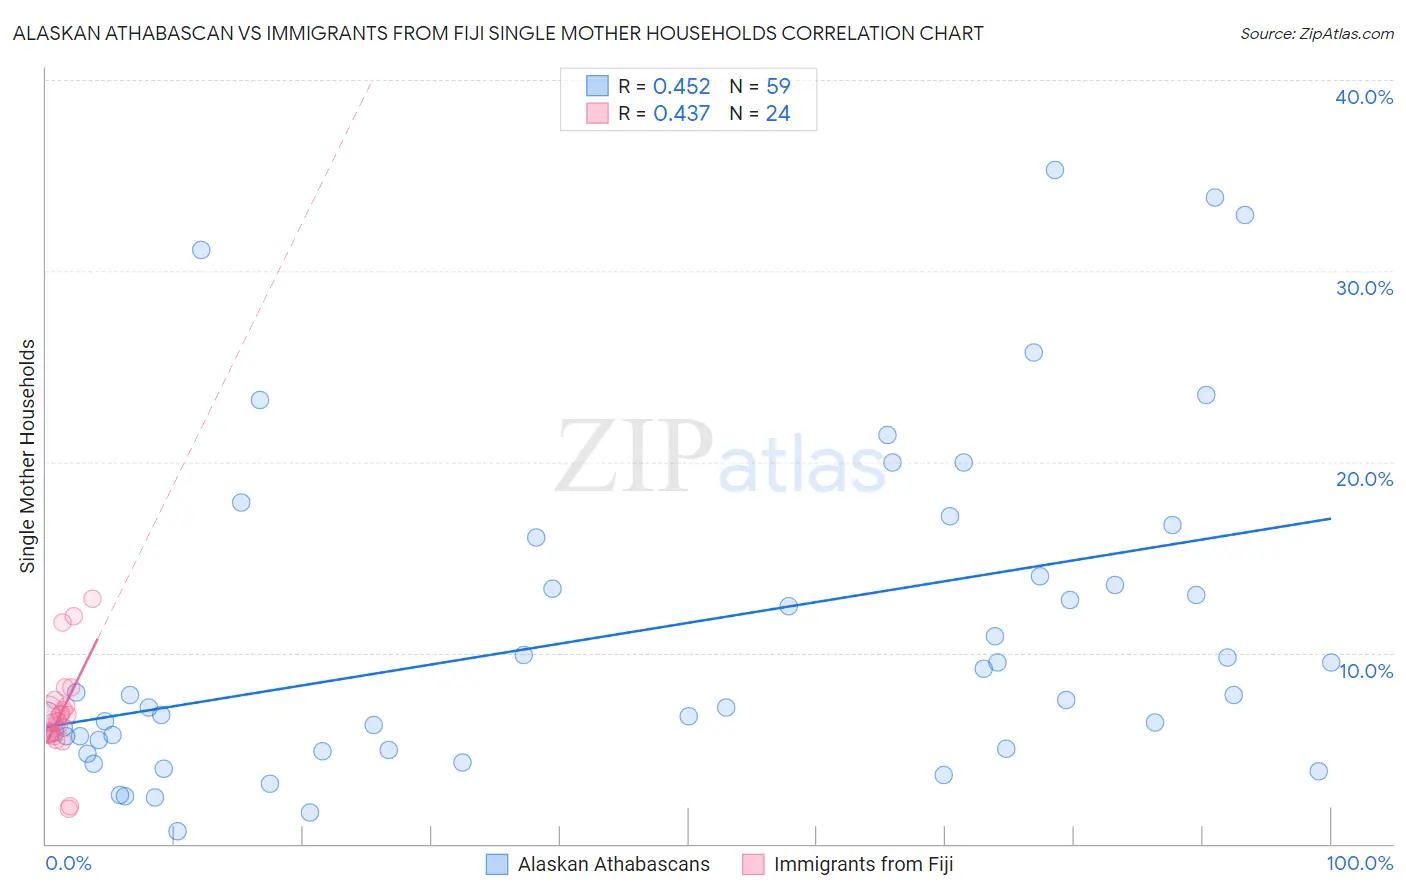
Alaskan Athabascan vs Immigrants from Fiji Single Mother Households Correlation Chart
The statistical analysis conducted on geographies consisting of 45,772,365 people shows a moderate positive correlation between the proportion of Alaskan Athabascans and percentage of single mother households in the United States with a correlation coefficient (R) of 0.452 and weighted average of 7.3%. Similarly, the statistical analysis conducted on geographies consisting of 93,728,014 people shows a moderate positive correlation between the proportion of Immigrants from Fiji and percentage of single mother households in the United States with a correlation coefficient (R) of 0.437 and weighted average of 6.7%, a difference of 9.8%.
Single Mother Households Correlation Summary
| Measurement | Alaskan Athabascan | Immigrants from Fiji |
| Minimum | 0.67% | 1.9% |
| Maximum | 35.3% | 12.8% |
| Range | 34.6% | 10.9% |
| Mean | 10.9% | 6.8% |
| Median | 7.5% | 6.6% |
| Interquartile 25% (IQ1) | 5.0% | 5.7% |
| Interquartile 75% (IQ3) | 14.0% | 7.4% |
| Interquartile Range (IQR) | 9.0% | 1.6% |
| Standard Deviation (Sample) | 8.5% | 2.5% |
| Standard Deviation (Population) | 8.4% | 2.5% |
Similar Demographics by Single Mother Households
Demographics Similar to Alaskan Athabascans by Single Mother Households
In terms of single mother households, the demographic groups most similar to Alaskan Athabascans are Malaysian (7.3%, a difference of 0.020%), Immigrants from Africa (7.3%, a difference of 0.37%), Bermudan (7.3%, a difference of 0.38%), Cajun (7.3%, a difference of 0.38%), and Immigrants from Ecuador (7.3%, a difference of 0.44%).
| Demographics | Rating | Rank | Single Mother Households |
| Immigrants | Cambodia | 0.5 /100 | #245 | Tragic 7.2% |
| Nicaraguans | 0.5 /100 | #246 | Tragic 7.2% |
| Dutch West Indians | 0.4 /100 | #247 | Tragic 7.3% |
| Spanish American Indians | 0.4 /100 | #248 | Tragic 7.3% |
| Bermudans | 0.4 /100 | #249 | Tragic 7.3% |
| Immigrants | Africa | 0.4 /100 | #250 | Tragic 7.3% |
| Malaysians | 0.3 /100 | #251 | Tragic 7.3% |
| Alaskan Athabascans | 0.3 /100 | #252 | Tragic 7.3% |
| Cajuns | 0.3 /100 | #253 | Tragic 7.3% |
| Immigrants | Ecuador | 0.3 /100 | #254 | Tragic 7.3% |
| Mexican American Indians | 0.2 /100 | #255 | Tragic 7.4% |
| Seminole | 0.2 /100 | #256 | Tragic 7.4% |
| Alaska Natives | 0.2 /100 | #257 | Tragic 7.4% |
| Pueblo | 0.2 /100 | #258 | Tragic 7.4% |
| Immigrants | Yemen | 0.2 /100 | #259 | Tragic 7.4% |
Demographics Similar to Immigrants from Fiji by Single Mother Households
In terms of single mother households, the demographic groups most similar to Immigrants from Fiji are Immigrants from Peru (6.7%, a difference of 0.010%), Cree (6.7%, a difference of 0.020%), German Russian (6.7%, a difference of 0.10%), Immigrants from South America (6.7%, a difference of 0.10%), and Guamanian/Chamorro (6.6%, a difference of 0.11%).
| Demographics | Rating | Rank | Single Mother Households |
| Moroccans | 17.4 /100 | #197 | Poor 6.6% |
| Hawaiians | 16.1 /100 | #198 | Poor 6.6% |
| Potawatomi | 15.5 /100 | #199 | Poor 6.6% |
| Immigrants | Ethiopia | 14.7 /100 | #200 | Poor 6.6% |
| Venezuelans | 12.9 /100 | #201 | Poor 6.6% |
| Guamanians/Chamorros | 12.4 /100 | #202 | Poor 6.6% |
| Immigrants | Peru | 12.0 /100 | #203 | Poor 6.7% |
| Immigrants | Fiji | 11.9 /100 | #204 | Poor 6.7% |
| Cree | 11.9 /100 | #205 | Poor 6.7% |
| German Russians | 11.5 /100 | #206 | Poor 6.7% |
| Immigrants | South America | 11.5 /100 | #207 | Poor 6.7% |
| Vietnamese | 11.3 /100 | #208 | Poor 6.7% |
| Immigrants | Colombia | 10.5 /100 | #209 | Poor 6.7% |
| Immigrants | Nonimmigrants | 10.4 /100 | #210 | Poor 6.7% |
| Immigrants | Venezuela | 8.5 /100 | #211 | Tragic 6.7% |