Alaskan Athabascan vs Scotch-Irish 3 or more Vehicles in Household
COMPARE
Alaskan Athabascan
Scotch-Irish
3 or more Vehicles in Household
3 or more Vehicles in Household Comparison
Alaskan Athabascans
Scotch-Irish
21.9%
3 OR MORE VEHICLES IN HOUSEHOLD
99.9/ 100
METRIC RATING
67th/ 347
METRIC RANK
22.6%
3 OR MORE VEHICLES IN HOUSEHOLD
100.0/ 100
METRIC RATING
49th/ 347
METRIC RANK
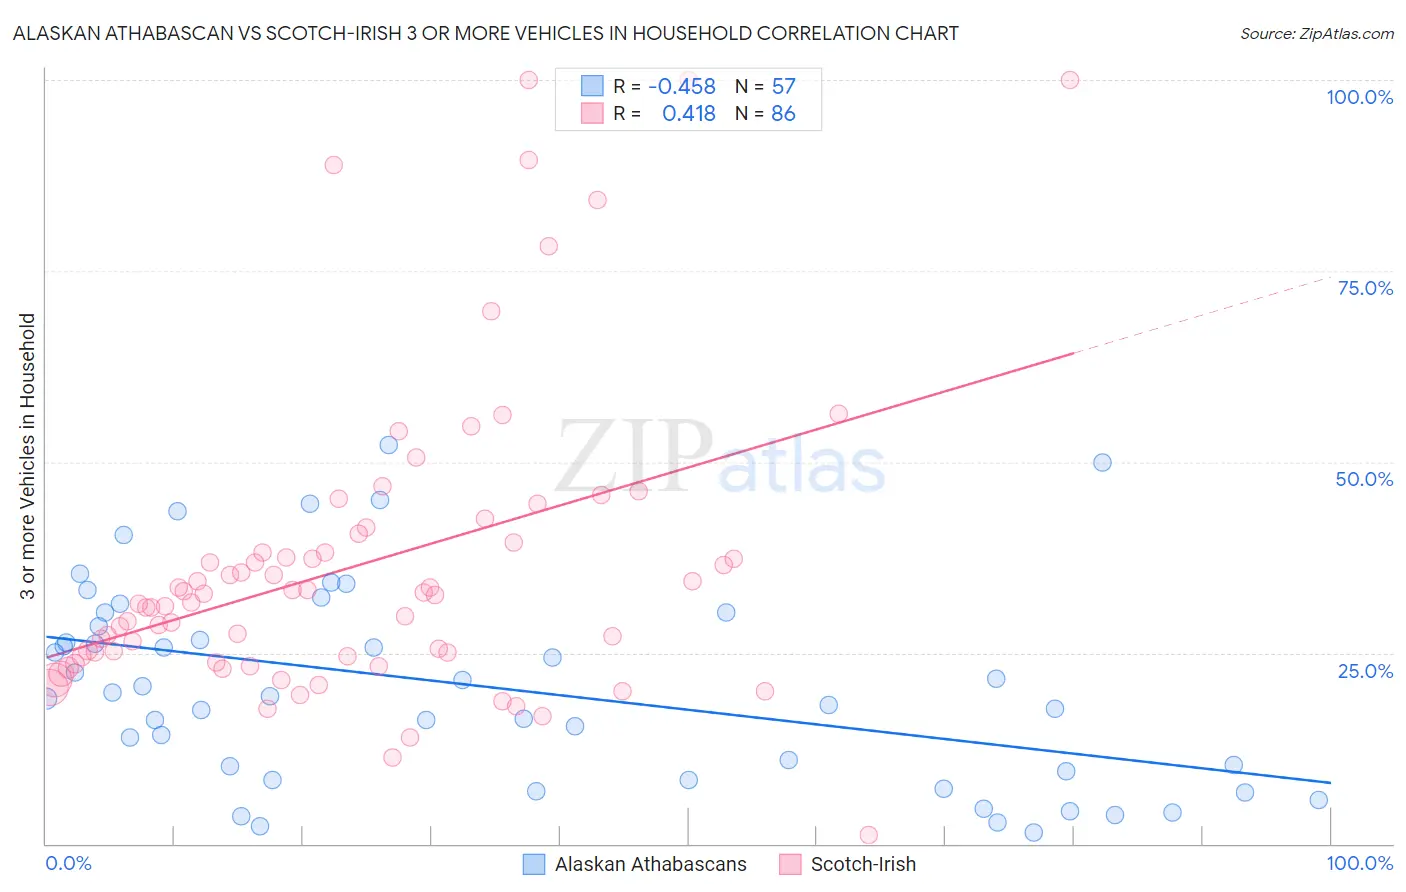
Alaskan Athabascan vs Scotch-Irish 3 or more Vehicles in Household Correlation Chart
The statistical analysis conducted on geographies consisting of 45,796,078 people shows a moderate negative correlation between the proportion of Alaskan Athabascans and percentage of households with 3 or more vehicles available in the United States with a correlation coefficient (R) of -0.458 and weighted average of 21.9%. Similarly, the statistical analysis conducted on geographies consisting of 548,181,208 people shows a moderate positive correlation between the proportion of Scotch-Irish and percentage of households with 3 or more vehicles available in the United States with a correlation coefficient (R) of 0.418 and weighted average of 22.6%, a difference of 2.9%.
3 or more Vehicles in Household Correlation Summary
| Measurement | Alaskan Athabascan | Scotch-Irish |
| Minimum | 1.4% | 1.1% |
| Maximum | 52.1% | 100.0% |
| Range | 50.7% | 98.9% |
| Mean | 20.6% | 36.4% |
| Median | 19.4% | 32.1% |
| Interquartile 25% (IQ1) | 8.9% | 24.5% |
| Interquartile 75% (IQ3) | 29.4% | 39.5% |
| Interquartile Range (IQR) | 20.5% | 15.0% |
| Standard Deviation (Sample) | 13.0% | 19.9% |
| Standard Deviation (Population) | 12.9% | 19.8% |
Demographics Similar to Alaskan Athabascans and Scotch-Irish by 3 or more Vehicles in Household
In terms of 3 or more vehicles in household, the demographic groups most similar to Alaskan Athabascans are British (21.9%, a difference of 0.15%), Northern European (22.0%, a difference of 0.26%), Pima (22.0%, a difference of 0.40%), Immigrants from Taiwan (22.1%, a difference of 0.82%), and Chickasaw (22.2%, a difference of 1.1%). Similarly, the demographic groups most similar to Scotch-Irish are Sioux (22.6%, a difference of 0.060%), White/Caucasian (22.6%, a difference of 0.060%), Scottish (22.6%, a difference of 0.10%), Welsh (22.6%, a difference of 0.11%), and Czech (22.5%, a difference of 0.36%).
| Demographics | Rating | Rank | 3 or more Vehicles in Household |
| Scottish | 100.0 /100 | #48 | Exceptional 22.6% |
| Scotch-Irish | 100.0 /100 | #49 | Exceptional 22.6% |
| Sioux | 100.0 /100 | #50 | Exceptional 22.6% |
| Whites/Caucasians | 100.0 /100 | #51 | Exceptional 22.6% |
| Welsh | 100.0 /100 | #52 | Exceptional 22.6% |
| Czechs | 100.0 /100 | #53 | Exceptional 22.5% |
| Crow | 100.0 /100 | #54 | Exceptional 22.5% |
| Immigrants | Laos | 100.0 /100 | #55 | Exceptional 22.4% |
| Hispanics or Latinos | 100.0 /100 | #56 | Exceptional 22.4% |
| Pennsylvania Germans | 100.0 /100 | #57 | Exceptional 22.3% |
| Spaniards | 100.0 /100 | #58 | Exceptional 22.3% |
| Navajo | 100.0 /100 | #59 | Exceptional 22.3% |
| Finns | 99.9 /100 | #60 | Exceptional 22.3% |
| Bhutanese | 99.9 /100 | #61 | Exceptional 22.2% |
| Fijians | 99.9 /100 | #62 | Exceptional 22.2% |
| Chickasaw | 99.9 /100 | #63 | Exceptional 22.2% |
| Immigrants | Taiwan | 99.9 /100 | #64 | Exceptional 22.1% |
| Pima | 99.9 /100 | #65 | Exceptional 22.0% |
| Northern Europeans | 99.9 /100 | #66 | Exceptional 22.0% |
| Alaskan Athabascans | 99.9 /100 | #67 | Exceptional 21.9% |
| British | 99.9 /100 | #68 | Exceptional 21.9% |