Immigrants from Cameroon vs Senegalese Currently Married
COMPARE
Immigrants from Cameroon
Senegalese
Currently Married
Currently Married Comparison
Immigrants from Cameroon
Senegalese
44.2%
CURRENTLY MARRIED
0.3/ 100
METRIC RATING
249th/ 347
METRIC RANK
40.6%
CURRENTLY MARRIED
0.0/ 100
METRIC RATING
327th/ 347
METRIC RANK
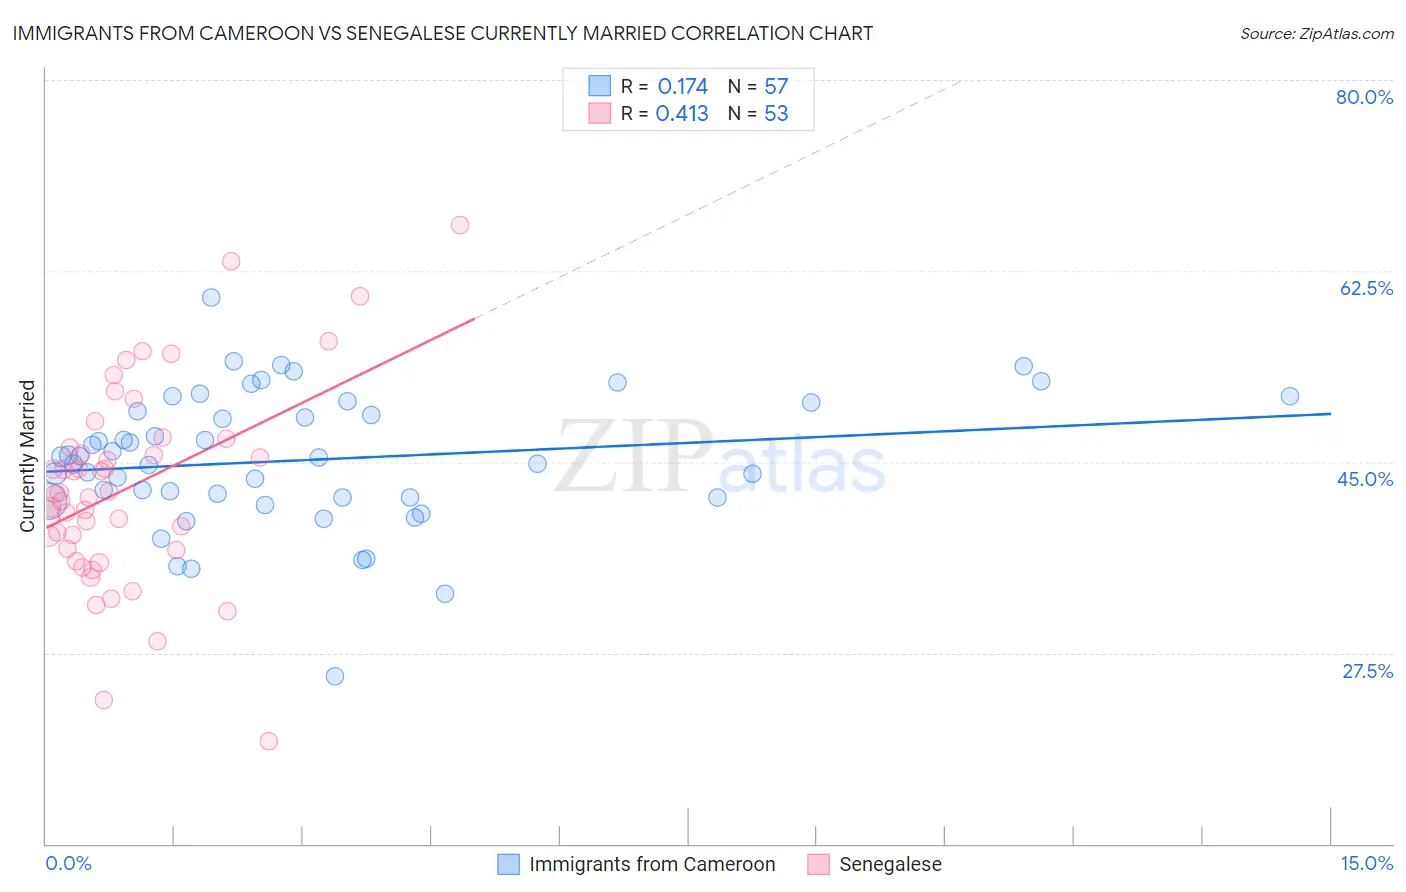
Immigrants from Cameroon vs Senegalese Currently Married Correlation Chart
The statistical analysis conducted on geographies consisting of 130,755,125 people shows a poor positive correlation between the proportion of Immigrants from Cameroon and percentage of population currently married in the United States with a correlation coefficient (R) of 0.174 and weighted average of 44.2%. Similarly, the statistical analysis conducted on geographies consisting of 78,135,474 people shows a moderate positive correlation between the proportion of Senegalese and percentage of population currently married in the United States with a correlation coefficient (R) of 0.413 and weighted average of 40.6%, a difference of 8.9%.
Currently Married Correlation Summary
| Measurement | Immigrants from Cameroon | Senegalese |
| Minimum | 25.4% | 19.4% |
| Maximum | 60.1% | 66.7% |
| Range | 34.7% | 47.3% |
| Mean | 45.2% | 42.6% |
| Median | 45.4% | 42.1% |
| Interquartile 25% (IQ1) | 41.7% | 37.0% |
| Interquartile 75% (IQ3) | 50.0% | 46.7% |
| Interquartile Range (IQR) | 8.3% | 9.7% |
| Standard Deviation (Sample) | 6.2% | 9.1% |
| Standard Deviation (Population) | 6.1% | 9.0% |
Similar Demographics by Currently Married
Demographics Similar to Immigrants from Cameroon by Currently Married
In terms of currently married, the demographic groups most similar to Immigrants from Cameroon are Nicaraguan (44.2%, a difference of 0.020%), Immigrants from Eastern Africa (44.2%, a difference of 0.020%), Blackfeet (44.2%, a difference of 0.080%), Ugandan (44.2%, a difference of 0.10%), and Hispanic or Latino (44.1%, a difference of 0.11%).
| Demographics | Rating | Rank | Currently Married |
| Immigrants | Cambodia | 0.7 /100 | #242 | Tragic 44.5% |
| Immigrants | Ethiopia | 0.7 /100 | #243 | Tragic 44.5% |
| Japanese | 0.6 /100 | #244 | Tragic 44.5% |
| Immigrants | Armenia | 0.4 /100 | #245 | Tragic 44.3% |
| Immigrants | Burma/Myanmar | 0.4 /100 | #246 | Tragic 44.3% |
| Ugandans | 0.4 /100 | #247 | Tragic 44.2% |
| Nicaraguans | 0.3 /100 | #248 | Tragic 44.2% |
| Immigrants | Cameroon | 0.3 /100 | #249 | Tragic 44.2% |
| Immigrants | Eastern Africa | 0.3 /100 | #250 | Tragic 44.2% |
| Blackfeet | 0.3 /100 | #251 | Tragic 44.2% |
| Hispanics or Latinos | 0.3 /100 | #252 | Tragic 44.1% |
| Immigrants | Central America | 0.3 /100 | #253 | Tragic 44.1% |
| Vietnamese | 0.2 /100 | #254 | Tragic 44.0% |
| Yakama | 0.2 /100 | #255 | Tragic 44.0% |
| Shoshone | 0.2 /100 | #256 | Tragic 44.0% |
Demographics Similar to Senegalese by Currently Married
In terms of currently married, the demographic groups most similar to Senegalese are Arapaho (40.5%, a difference of 0.040%), Barbadian (40.6%, a difference of 0.17%), U.S. Virgin Islander (40.7%, a difference of 0.31%), Immigrants from Senegal (40.7%, a difference of 0.36%), and Immigrants from West Indies (40.7%, a difference of 0.37%).
| Demographics | Rating | Rank | Currently Married |
| Immigrants | Jamaica | 0.0 /100 | #320 | Tragic 41.1% |
| Immigrants | Congo | 0.0 /100 | #321 | Tragic 41.1% |
| Immigrants | Haiti | 0.0 /100 | #322 | Tragic 41.0% |
| Immigrants | West Indies | 0.0 /100 | #323 | Tragic 40.7% |
| Immigrants | Senegal | 0.0 /100 | #324 | Tragic 40.7% |
| U.S. Virgin Islanders | 0.0 /100 | #325 | Tragic 40.7% |
| Barbadians | 0.0 /100 | #326 | Tragic 40.6% |
| Senegalese | 0.0 /100 | #327 | Tragic 40.6% |
| Arapaho | 0.0 /100 | #328 | Tragic 40.5% |
| Crow | 0.0 /100 | #329 | Tragic 40.4% |
| Immigrants | Dominica | 0.0 /100 | #330 | Tragic 40.3% |
| Immigrants | Barbados | 0.0 /100 | #331 | Tragic 40.3% |
| Immigrants | St. Vincent and the Grenadines | 0.0 /100 | #332 | Tragic 40.1% |
| Yup'ik | 0.0 /100 | #333 | Tragic 39.9% |
| Puerto Ricans | 0.0 /100 | #334 | Tragic 39.9% |