Immigrants from Nepal vs Senegalese Currently Married
COMPARE
Immigrants from Nepal
Senegalese
Currently Married
Currently Married Comparison
Immigrants from Nepal
Senegalese
46.1%
CURRENTLY MARRIED
23.7/ 100
METRIC RATING
195th/ 347
METRIC RANK
40.6%
CURRENTLY MARRIED
0.0/ 100
METRIC RATING
327th/ 347
METRIC RANK
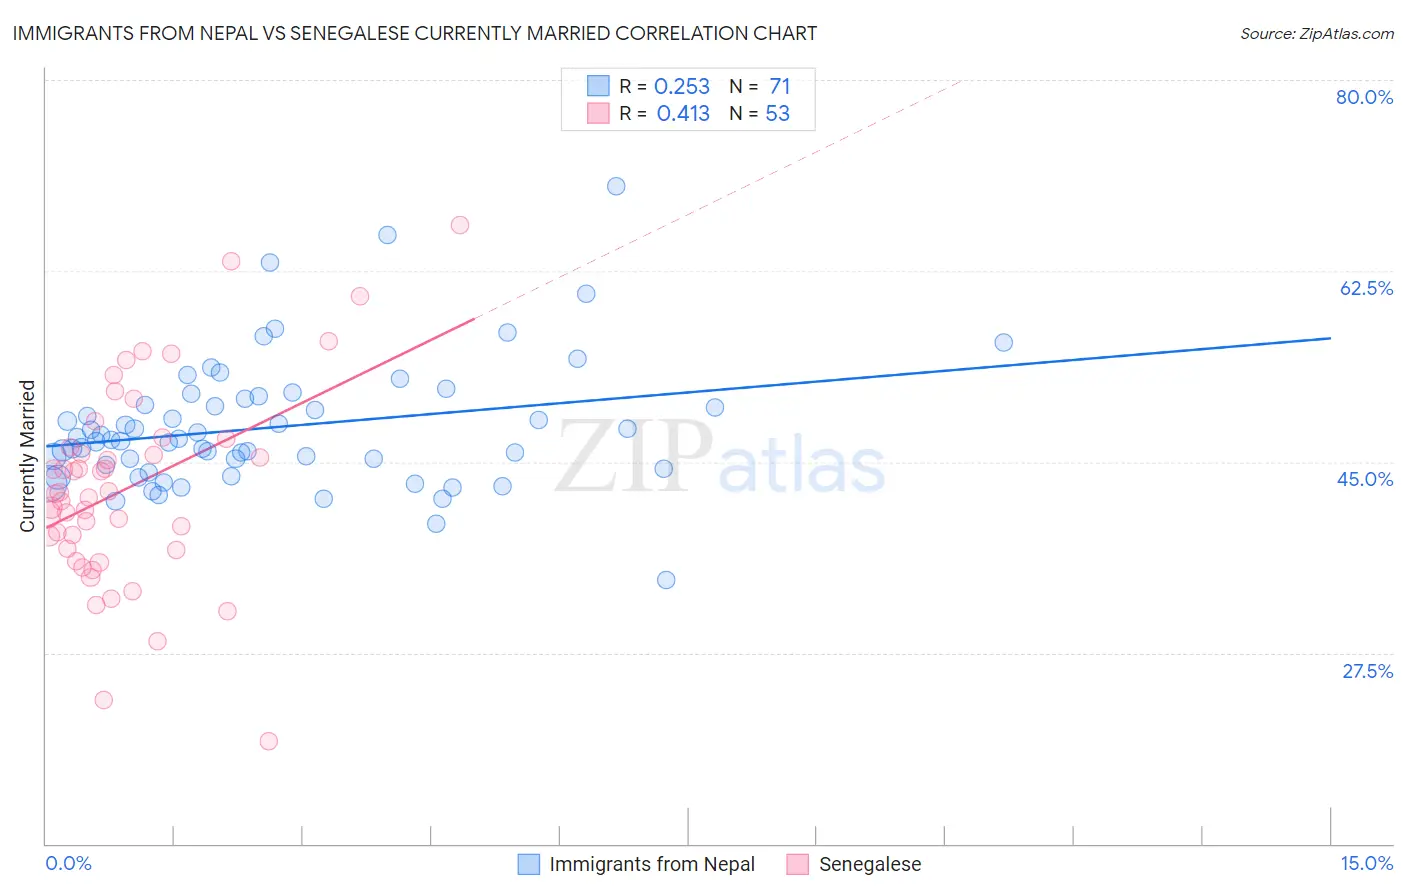
Immigrants from Nepal vs Senegalese Currently Married Correlation Chart
The statistical analysis conducted on geographies consisting of 186,760,153 people shows a weak positive correlation between the proportion of Immigrants from Nepal and percentage of population currently married in the United States with a correlation coefficient (R) of 0.253 and weighted average of 46.1%. Similarly, the statistical analysis conducted on geographies consisting of 78,135,474 people shows a moderate positive correlation between the proportion of Senegalese and percentage of population currently married in the United States with a correlation coefficient (R) of 0.413 and weighted average of 40.6%, a difference of 13.7%.
Currently Married Correlation Summary
| Measurement | Immigrants from Nepal | Senegalese |
| Minimum | 34.2% | 19.4% |
| Maximum | 70.3% | 66.7% |
| Range | 36.1% | 47.3% |
| Mean | 48.2% | 42.6% |
| Median | 47.1% | 42.1% |
| Interquartile 25% (IQ1) | 44.4% | 37.0% |
| Interquartile 75% (IQ3) | 50.8% | 46.7% |
| Interquartile Range (IQR) | 6.4% | 9.7% |
| Standard Deviation (Sample) | 6.0% | 9.1% |
| Standard Deviation (Population) | 5.9% | 9.0% |
Similar Demographics by Currently Married
Demographics Similar to Immigrants from Nepal by Currently Married
In terms of currently married, the demographic groups most similar to Immigrants from Nepal are South American (46.1%, a difference of 0.010%), Immigrants from Fiji (46.2%, a difference of 0.070%), Immigrants from Bosnia and Herzegovina (46.1%, a difference of 0.070%), Soviet Union (46.2%, a difference of 0.10%), and Immigrants from Kuwait (46.1%, a difference of 0.10%).
| Demographics | Rating | Rank | Currently Married |
| Colombians | 31.8 /100 | #188 | Fair 46.3% |
| Fijians | 30.3 /100 | #189 | Fair 46.3% |
| Choctaw | 29.1 /100 | #190 | Fair 46.3% |
| Immigrants | France | 27.7 /100 | #191 | Fair 46.2% |
| Soviet Union | 25.7 /100 | #192 | Fair 46.2% |
| Immigrants | Fiji | 25.0 /100 | #193 | Fair 46.2% |
| South Americans | 23.8 /100 | #194 | Fair 46.1% |
| Immigrants | Nepal | 23.7 /100 | #195 | Fair 46.1% |
| Immigrants | Bosnia and Herzegovina | 22.2 /100 | #196 | Fair 46.1% |
| Immigrants | Kuwait | 21.7 /100 | #197 | Fair 46.1% |
| Immigrants | Colombia | 21.0 /100 | #198 | Fair 46.1% |
| Immigrants | Costa Rica | 19.6 /100 | #199 | Poor 46.0% |
| Creek | 17.2 /100 | #200 | Poor 46.0% |
| Malaysians | 15.3 /100 | #201 | Poor 45.9% |
| Immigrants | Albania | 14.5 /100 | #202 | Poor 45.9% |
Demographics Similar to Senegalese by Currently Married
In terms of currently married, the demographic groups most similar to Senegalese are Arapaho (40.5%, a difference of 0.040%), Barbadian (40.6%, a difference of 0.17%), U.S. Virgin Islander (40.7%, a difference of 0.31%), Immigrants from Senegal (40.7%, a difference of 0.36%), and Immigrants from West Indies (40.7%, a difference of 0.37%).
| Demographics | Rating | Rank | Currently Married |
| Immigrants | Jamaica | 0.0 /100 | #320 | Tragic 41.1% |
| Immigrants | Congo | 0.0 /100 | #321 | Tragic 41.1% |
| Immigrants | Haiti | 0.0 /100 | #322 | Tragic 41.0% |
| Immigrants | West Indies | 0.0 /100 | #323 | Tragic 40.7% |
| Immigrants | Senegal | 0.0 /100 | #324 | Tragic 40.7% |
| U.S. Virgin Islanders | 0.0 /100 | #325 | Tragic 40.7% |
| Barbadians | 0.0 /100 | #326 | Tragic 40.6% |
| Senegalese | 0.0 /100 | #327 | Tragic 40.6% |
| Arapaho | 0.0 /100 | #328 | Tragic 40.5% |
| Crow | 0.0 /100 | #329 | Tragic 40.4% |
| Immigrants | Dominica | 0.0 /100 | #330 | Tragic 40.3% |
| Immigrants | Barbados | 0.0 /100 | #331 | Tragic 40.3% |
| Immigrants | St. Vincent and the Grenadines | 0.0 /100 | #332 | Tragic 40.1% |
| Yup'ik | 0.0 /100 | #333 | Tragic 39.9% |
| Puerto Ricans | 0.0 /100 | #334 | Tragic 39.9% |