Immigrants from the Azores vs Senegalese Currently Married
COMPARE
Immigrants from the Azores
Senegalese
Currently Married
Currently Married Comparison
Immigrants from the Azores
Senegalese
45.1%
CURRENTLY MARRIED
2.5/ 100
METRIC RATING
222nd/ 347
METRIC RANK
40.6%
CURRENTLY MARRIED
0.0/ 100
METRIC RATING
327th/ 347
METRIC RANK
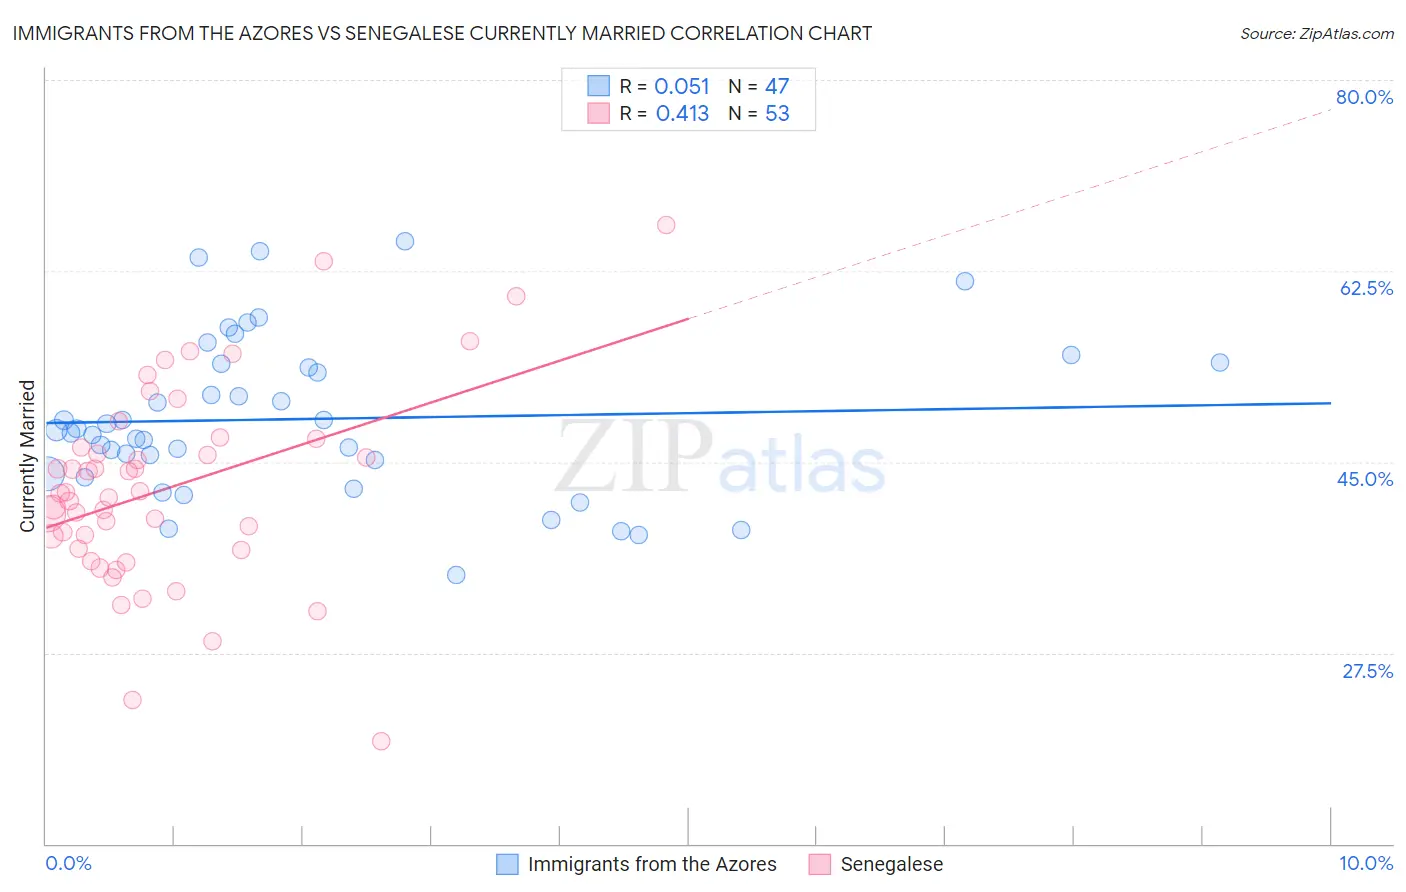
Immigrants from the Azores vs Senegalese Currently Married Correlation Chart
The statistical analysis conducted on geographies consisting of 46,256,915 people shows a slight positive correlation between the proportion of Immigrants from the Azores and percentage of population currently married in the United States with a correlation coefficient (R) of 0.051 and weighted average of 45.1%. Similarly, the statistical analysis conducted on geographies consisting of 78,135,474 people shows a moderate positive correlation between the proportion of Senegalese and percentage of population currently married in the United States with a correlation coefficient (R) of 0.413 and weighted average of 40.6%, a difference of 11.1%.
Currently Married Correlation Summary
| Measurement | Immigrants from the Azores | Senegalese |
| Minimum | 34.6% | 19.4% |
| Maximum | 65.2% | 66.7% |
| Range | 30.6% | 47.3% |
| Mean | 48.9% | 42.6% |
| Median | 47.9% | 42.1% |
| Interquartile 25% (IQ1) | 43.9% | 37.0% |
| Interquartile 75% (IQ3) | 54.0% | 46.7% |
| Interquartile Range (IQR) | 10.1% | 9.7% |
| Standard Deviation (Sample) | 7.2% | 9.1% |
| Standard Deviation (Population) | 7.2% | 9.0% |
Similar Demographics by Currently Married
Demographics Similar to Immigrants from the Azores by Currently Married
In terms of currently married, the demographic groups most similar to Immigrants from the Azores are Immigrants from Laos (45.0%, a difference of 0.080%), Immigrants from Uganda (45.0%, a difference of 0.13%), French American Indian (45.0%, a difference of 0.13%), Comanche (45.0%, a difference of 0.18%), and Spanish American (45.0%, a difference of 0.18%).
| Demographics | Rating | Rank | Currently Married |
| German Russians | 6.7 /100 | #215 | Tragic 45.5% |
| Immigrants | Morocco | 5.5 /100 | #216 | Tragic 45.4% |
| Immigrants | Thailand | 5.1 /100 | #217 | Tragic 45.4% |
| Panamanians | 4.0 /100 | #218 | Tragic 45.3% |
| Immigrants | Portugal | 3.5 /100 | #219 | Tragic 45.2% |
| Kenyans | 3.1 /100 | #220 | Tragic 45.2% |
| Mexicans | 3.0 /100 | #221 | Tragic 45.2% |
| Immigrants | Azores | 2.5 /100 | #222 | Tragic 45.1% |
| Immigrants | Laos | 2.3 /100 | #223 | Tragic 45.0% |
| Immigrants | Uganda | 2.2 /100 | #224 | Tragic 45.0% |
| French American Indians | 2.2 /100 | #225 | Tragic 45.0% |
| Comanche | 2.1 /100 | #226 | Tragic 45.0% |
| Spanish Americans | 2.1 /100 | #227 | Tragic 45.0% |
| Immigrants | Uruguay | 2.0 /100 | #228 | Tragic 45.0% |
| Cree | 1.7 /100 | #229 | Tragic 44.9% |
Demographics Similar to Senegalese by Currently Married
In terms of currently married, the demographic groups most similar to Senegalese are Arapaho (40.5%, a difference of 0.040%), Barbadian (40.6%, a difference of 0.17%), U.S. Virgin Islander (40.7%, a difference of 0.31%), Immigrants from Senegal (40.7%, a difference of 0.36%), and Immigrants from West Indies (40.7%, a difference of 0.37%).
| Demographics | Rating | Rank | Currently Married |
| Immigrants | Jamaica | 0.0 /100 | #320 | Tragic 41.1% |
| Immigrants | Congo | 0.0 /100 | #321 | Tragic 41.1% |
| Immigrants | Haiti | 0.0 /100 | #322 | Tragic 41.0% |
| Immigrants | West Indies | 0.0 /100 | #323 | Tragic 40.7% |
| Immigrants | Senegal | 0.0 /100 | #324 | Tragic 40.7% |
| U.S. Virgin Islanders | 0.0 /100 | #325 | Tragic 40.7% |
| Barbadians | 0.0 /100 | #326 | Tragic 40.6% |
| Senegalese | 0.0 /100 | #327 | Tragic 40.6% |
| Arapaho | 0.0 /100 | #328 | Tragic 40.5% |
| Crow | 0.0 /100 | #329 | Tragic 40.4% |
| Immigrants | Dominica | 0.0 /100 | #330 | Tragic 40.3% |
| Immigrants | Barbados | 0.0 /100 | #331 | Tragic 40.3% |
| Immigrants | St. Vincent and the Grenadines | 0.0 /100 | #332 | Tragic 40.1% |
| Yup'ik | 0.0 /100 | #333 | Tragic 39.9% |
| Puerto Ricans | 0.0 /100 | #334 | Tragic 39.9% |