Ottawa vs Senegalese Currently Married
COMPARE
Ottawa
Senegalese
Currently Married
Currently Married Comparison
Ottawa
Senegalese
46.5%
CURRENTLY MARRIED
43.0/ 100
METRIC RATING
181st/ 347
METRIC RANK
40.6%
CURRENTLY MARRIED
0.0/ 100
METRIC RATING
327th/ 347
METRIC RANK
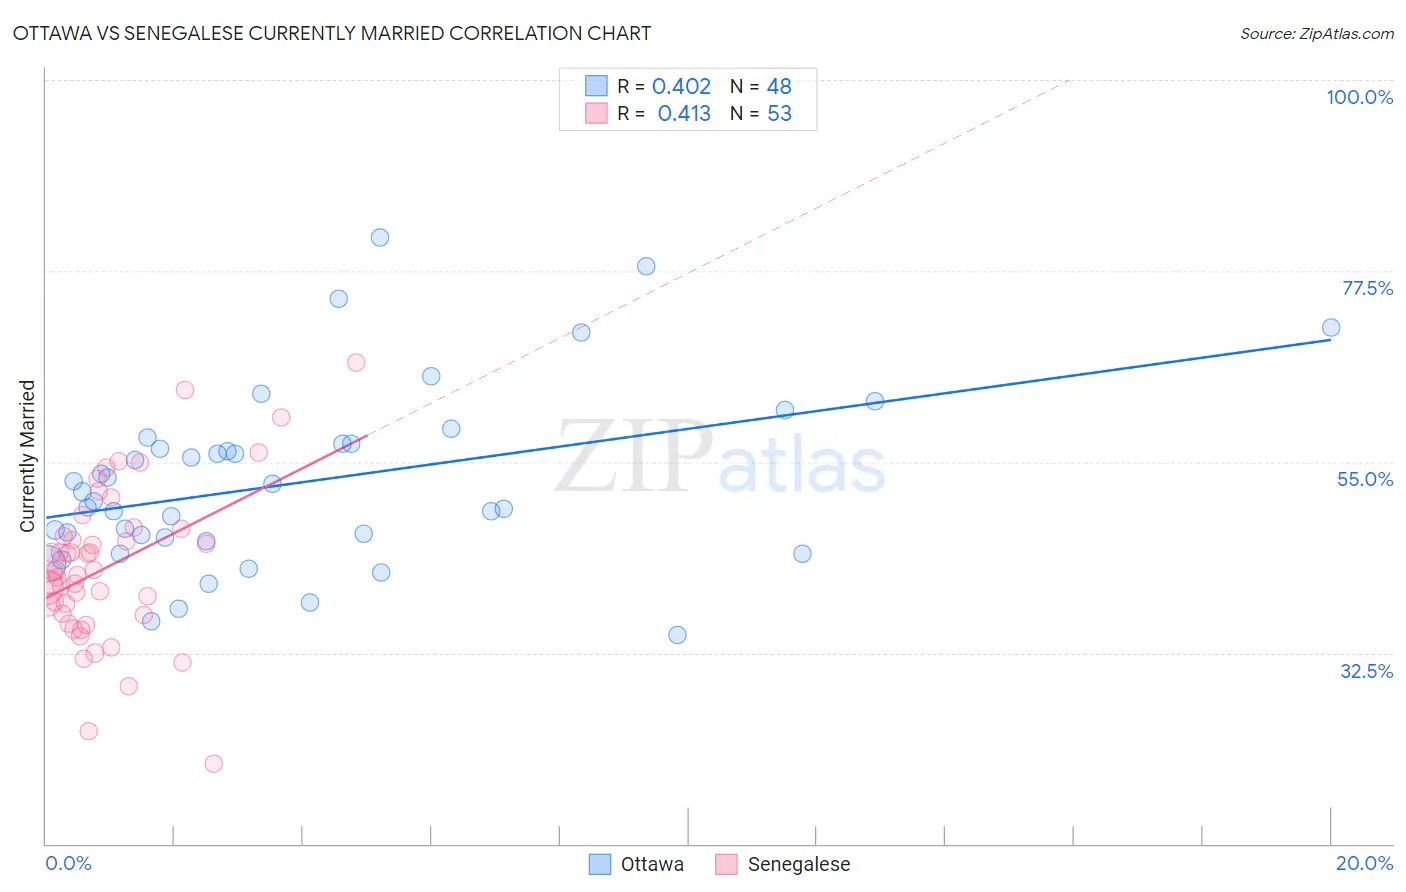
Ottawa vs Senegalese Currently Married Correlation Chart
The statistical analysis conducted on geographies consisting of 49,956,726 people shows a moderate positive correlation between the proportion of Ottawa and percentage of population currently married in the United States with a correlation coefficient (R) of 0.402 and weighted average of 46.5%. Similarly, the statistical analysis conducted on geographies consisting of 78,135,474 people shows a moderate positive correlation between the proportion of Senegalese and percentage of population currently married in the United States with a correlation coefficient (R) of 0.413 and weighted average of 40.6%, a difference of 14.7%.
Currently Married Correlation Summary
| Measurement | Ottawa | Senegalese |
| Minimum | 34.6% | 19.4% |
| Maximum | 81.4% | 66.7% |
| Range | 46.8% | 47.3% |
| Mean | 52.6% | 42.6% |
| Median | 50.9% | 42.1% |
| Interquartile 25% (IQ1) | 45.9% | 37.0% |
| Interquartile 75% (IQ3) | 57.2% | 46.7% |
| Interquartile Range (IQR) | 11.2% | 9.7% |
| Standard Deviation (Sample) | 10.5% | 9.1% |
| Standard Deviation (Population) | 10.4% | 9.0% |
Similar Demographics by Currently Married
Demographics Similar to Ottawa by Currently Married
In terms of currently married, the demographic groups most similar to Ottawa are Costa Rican (46.5%, a difference of 0.020%), Potawatomi (46.5%, a difference of 0.040%), Immigrants from Oceania (46.5%, a difference of 0.060%), Immigrants from Northern Africa (46.5%, a difference of 0.13%), and Brazilian (46.4%, a difference of 0.14%).
| Demographics | Rating | Rank | Currently Married |
| Peruvians | 50.0 /100 | #174 | Average 46.6% |
| Immigrants | Brazil | 49.9 /100 | #175 | Average 46.6% |
| Hawaiians | 48.6 /100 | #176 | Average 46.6% |
| Israelis | 48.6 /100 | #177 | Average 46.6% |
| Chickasaw | 47.8 /100 | #178 | Average 46.6% |
| Immigrants | Oceania | 44.6 /100 | #179 | Average 46.5% |
| Costa Ricans | 43.7 /100 | #180 | Average 46.5% |
| Ottawa | 43.0 /100 | #181 | Average 46.5% |
| Potawatomi | 41.9 /100 | #182 | Average 46.5% |
| Immigrants | Northern Africa | 39.7 /100 | #183 | Fair 46.5% |
| Brazilians | 39.3 /100 | #184 | Fair 46.4% |
| Mongolians | 37.6 /100 | #185 | Fair 46.4% |
| Immigrants | Chile | 36.8 /100 | #186 | Fair 46.4% |
| Immigrants | Peru | 35.3 /100 | #187 | Fair 46.4% |
| Colombians | 31.8 /100 | #188 | Fair 46.3% |
Demographics Similar to Senegalese by Currently Married
In terms of currently married, the demographic groups most similar to Senegalese are Arapaho (40.5%, a difference of 0.040%), Barbadian (40.6%, a difference of 0.17%), U.S. Virgin Islander (40.7%, a difference of 0.31%), Immigrants from Senegal (40.7%, a difference of 0.36%), and Immigrants from West Indies (40.7%, a difference of 0.37%).
| Demographics | Rating | Rank | Currently Married |
| Immigrants | Jamaica | 0.0 /100 | #320 | Tragic 41.1% |
| Immigrants | Congo | 0.0 /100 | #321 | Tragic 41.1% |
| Immigrants | Haiti | 0.0 /100 | #322 | Tragic 41.0% |
| Immigrants | West Indies | 0.0 /100 | #323 | Tragic 40.7% |
| Immigrants | Senegal | 0.0 /100 | #324 | Tragic 40.7% |
| U.S. Virgin Islanders | 0.0 /100 | #325 | Tragic 40.7% |
| Barbadians | 0.0 /100 | #326 | Tragic 40.6% |
| Senegalese | 0.0 /100 | #327 | Tragic 40.6% |
| Arapaho | 0.0 /100 | #328 | Tragic 40.5% |
| Crow | 0.0 /100 | #329 | Tragic 40.4% |
| Immigrants | Dominica | 0.0 /100 | #330 | Tragic 40.3% |
| Immigrants | Barbados | 0.0 /100 | #331 | Tragic 40.3% |
| Immigrants | St. Vincent and the Grenadines | 0.0 /100 | #332 | Tragic 40.1% |
| Yup'ik | 0.0 /100 | #333 | Tragic 39.9% |
| Puerto Ricans | 0.0 /100 | #334 | Tragic 39.9% |