African vs Salvadoran Divorced or Separated
COMPARE
African
Salvadoran
Divorced or Separated
Divorced or Separated Comparison
Africans
Salvadorans
13.2%
DIVORCED OR SEPARATED
0.0/ 100
METRIC RATING
310th/ 347
METRIC RANK
11.6%
DIVORCED OR SEPARATED
98.2/ 100
METRIC RATING
104th/ 347
METRIC RANK
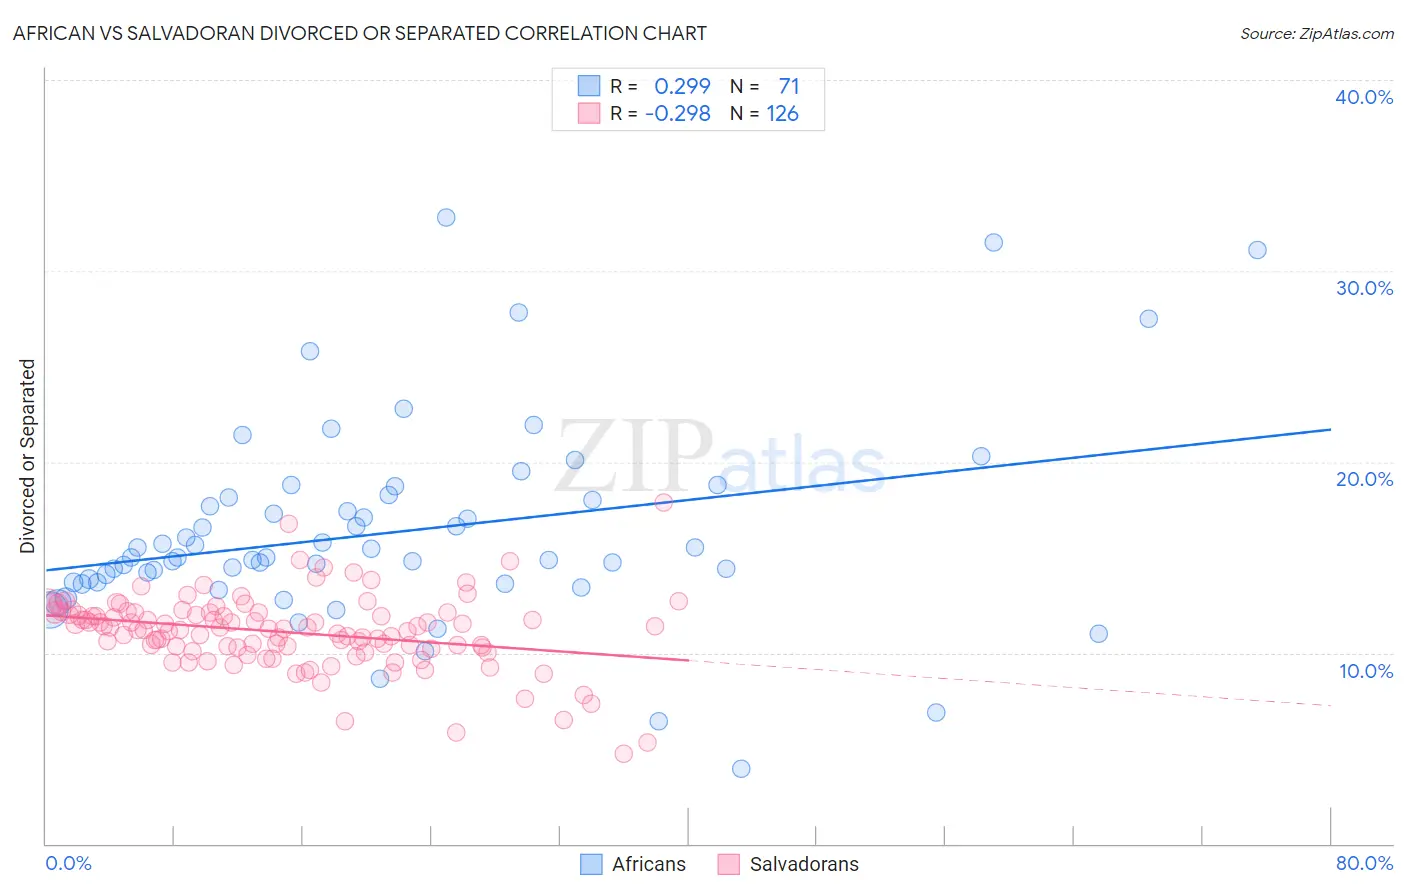
African vs Salvadoran Divorced or Separated Correlation Chart
The statistical analysis conducted on geographies consisting of 469,800,518 people shows a weak positive correlation between the proportion of Africans and percentage of population currently divorced or separated in the United States with a correlation coefficient (R) of 0.299 and weighted average of 13.2%. Similarly, the statistical analysis conducted on geographies consisting of 398,863,882 people shows a weak negative correlation between the proportion of Salvadorans and percentage of population currently divorced or separated in the United States with a correlation coefficient (R) of -0.298 and weighted average of 11.6%, a difference of 13.7%.
Divorced or Separated Correlation Summary
| Measurement | African | Salvadoran |
| Minimum | 3.9% | 4.7% |
| Maximum | 32.8% | 17.9% |
| Range | 28.9% | 13.2% |
| Mean | 16.3% | 11.1% |
| Median | 15.0% | 11.3% |
| Interquartile 25% (IQ1) | 13.7% | 10.3% |
| Interquartile 75% (IQ3) | 18.1% | 12.1% |
| Interquartile Range (IQR) | 4.4% | 1.8% |
| Standard Deviation (Sample) | 5.3% | 1.9% |
| Standard Deviation (Population) | 5.3% | 1.9% |
Similar Demographics by Divorced or Separated
Demographics Similar to Africans by Divorced or Separated
In terms of divorced or separated, the demographic groups most similar to Africans are American (13.2%, a difference of 0.020%), Sioux (13.2%, a difference of 0.020%), Ottawa (13.2%, a difference of 0.030%), French American Indian (13.2%, a difference of 0.12%), and Blackfeet (13.3%, a difference of 0.37%).
| Demographics | Rating | Rank | Divorced or Separated |
| Cape Verdeans | 0.0 /100 | #303 | Tragic 13.1% |
| Hopi | 0.0 /100 | #304 | Tragic 13.2% |
| Chippewa | 0.0 /100 | #305 | Tragic 13.2% |
| Tlingit-Haida | 0.0 /100 | #306 | Tragic 13.2% |
| French American Indians | 0.0 /100 | #307 | Tragic 13.2% |
| Ottawa | 0.0 /100 | #308 | Tragic 13.2% |
| Americans | 0.0 /100 | #309 | Tragic 13.2% |
| Africans | 0.0 /100 | #310 | Tragic 13.2% |
| Sioux | 0.0 /100 | #311 | Tragic 13.2% |
| Blackfeet | 0.0 /100 | #312 | Tragic 13.3% |
| Immigrants | Nicaragua | 0.0 /100 | #313 | Tragic 13.3% |
| Yaqui | 0.0 /100 | #314 | Tragic 13.3% |
| Spanish Americans | 0.0 /100 | #315 | Tragic 13.3% |
| Tsimshian | 0.0 /100 | #316 | Tragic 13.3% |
| Haitians | 0.0 /100 | #317 | Tragic 13.3% |
Demographics Similar to Salvadorans by Divorced or Separated
In terms of divorced or separated, the demographic groups most similar to Salvadorans are Maltese (11.6%, a difference of 0.020%), Immigrants from Croatia (11.6%, a difference of 0.050%), Immigrants from El Salvador (11.7%, a difference of 0.12%), Immigrants from Kazakhstan (11.7%, a difference of 0.16%), and Immigrants from Guyana (11.6%, a difference of 0.19%).
| Demographics | Rating | Rank | Divorced or Separated |
| Latvians | 98.7 /100 | #97 | Exceptional 11.6% |
| Immigrants | Jordan | 98.6 /100 | #98 | Exceptional 11.6% |
| Immigrants | Sweden | 98.6 /100 | #99 | Exceptional 11.6% |
| Immigrants | Northern Europe | 98.6 /100 | #100 | Exceptional 11.6% |
| Immigrants | Guyana | 98.5 /100 | #101 | Exceptional 11.6% |
| Immigrants | Croatia | 98.3 /100 | #102 | Exceptional 11.6% |
| Maltese | 98.2 /100 | #103 | Exceptional 11.6% |
| Salvadorans | 98.2 /100 | #104 | Exceptional 11.6% |
| Immigrants | El Salvador | 97.9 /100 | #105 | Exceptional 11.7% |
| Immigrants | Kazakhstan | 97.8 /100 | #106 | Exceptional 11.7% |
| Native Hawaiians | 97.2 /100 | #107 | Exceptional 11.7% |
| Greeks | 96.9 /100 | #108 | Exceptional 11.7% |
| Immigrants | South Africa | 96.9 /100 | #109 | Exceptional 11.7% |
| Immigrants | Czechoslovakia | 96.9 /100 | #110 | Exceptional 11.7% |
| Immigrants | Spain | 96.8 /100 | #111 | Exceptional 11.7% |