African vs Carpatho Rusyn Divorced or Separated
COMPARE
African
Carpatho Rusyn
Divorced or Separated
Divorced or Separated Comparison
Africans
Carpatho Rusyns
13.2%
DIVORCED OR SEPARATED
0.0/ 100
METRIC RATING
310th/ 347
METRIC RANK
11.9%
DIVORCED OR SEPARATED
84.8/ 100
METRIC RATING
136th/ 347
METRIC RANK
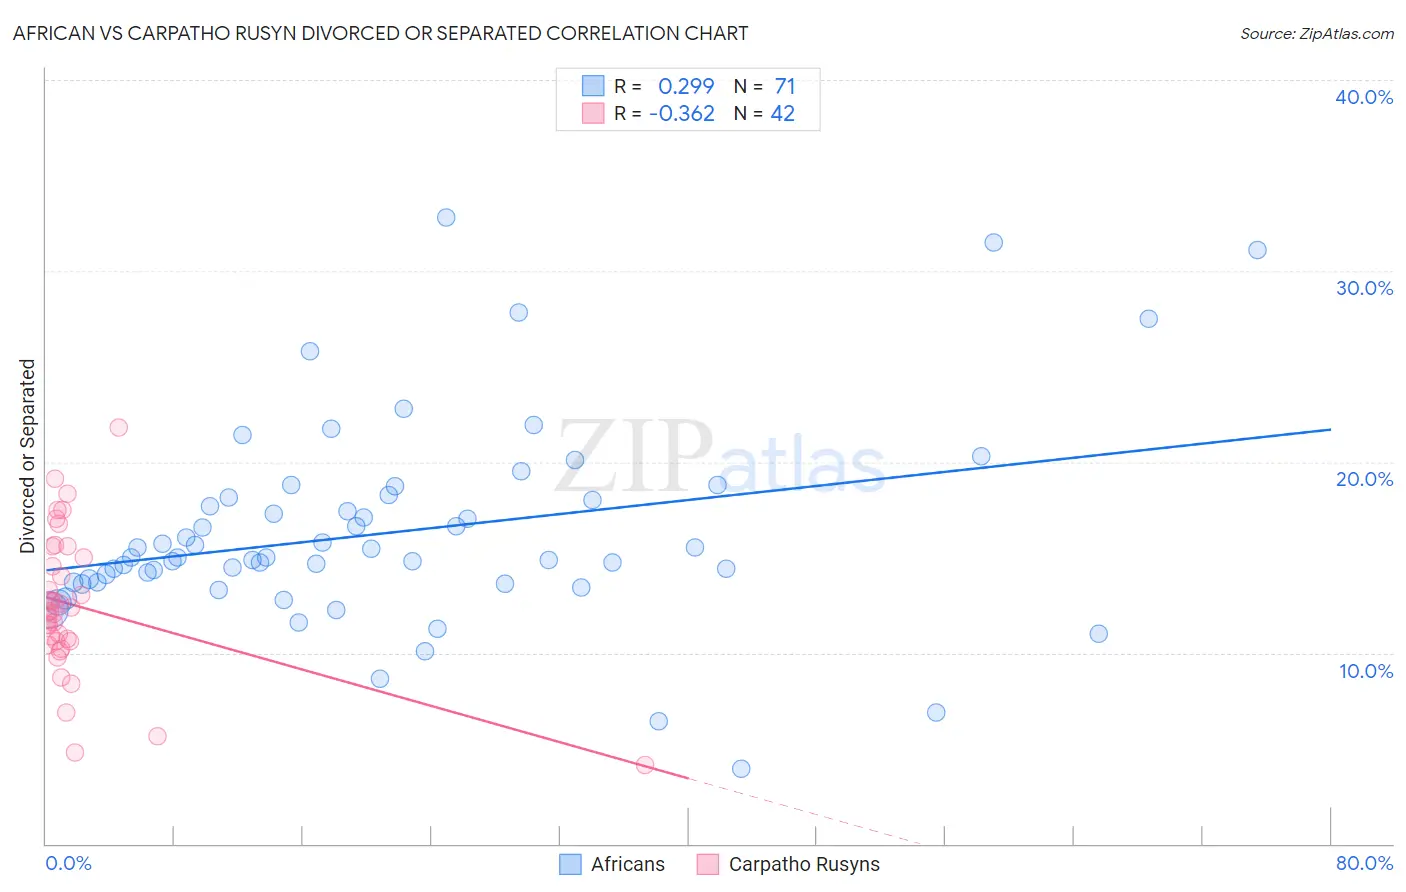
African vs Carpatho Rusyn Divorced or Separated Correlation Chart
The statistical analysis conducted on geographies consisting of 469,800,518 people shows a weak positive correlation between the proportion of Africans and percentage of population currently divorced or separated in the United States with a correlation coefficient (R) of 0.299 and weighted average of 13.2%. Similarly, the statistical analysis conducted on geographies consisting of 58,871,690 people shows a mild negative correlation between the proportion of Carpatho Rusyns and percentage of population currently divorced or separated in the United States with a correlation coefficient (R) of -0.362 and weighted average of 11.9%, a difference of 11.4%.
Divorced or Separated Correlation Summary
| Measurement | African | Carpatho Rusyn |
| Minimum | 3.9% | 4.1% |
| Maximum | 32.8% | 21.8% |
| Range | 28.9% | 17.7% |
| Mean | 16.3% | 12.5% |
| Median | 15.0% | 12.1% |
| Interquartile 25% (IQ1) | 13.7% | 10.6% |
| Interquartile 75% (IQ3) | 18.1% | 15.0% |
| Interquartile Range (IQR) | 4.4% | 4.4% |
| Standard Deviation (Sample) | 5.3% | 3.7% |
| Standard Deviation (Population) | 5.3% | 3.7% |
Similar Demographics by Divorced or Separated
Demographics Similar to Africans by Divorced or Separated
In terms of divorced or separated, the demographic groups most similar to Africans are American (13.2%, a difference of 0.020%), Sioux (13.2%, a difference of 0.020%), Ottawa (13.2%, a difference of 0.030%), French American Indian (13.2%, a difference of 0.12%), and Blackfeet (13.3%, a difference of 0.37%).
| Demographics | Rating | Rank | Divorced or Separated |
| Cape Verdeans | 0.0 /100 | #303 | Tragic 13.1% |
| Hopi | 0.0 /100 | #304 | Tragic 13.2% |
| Chippewa | 0.0 /100 | #305 | Tragic 13.2% |
| Tlingit-Haida | 0.0 /100 | #306 | Tragic 13.2% |
| French American Indians | 0.0 /100 | #307 | Tragic 13.2% |
| Ottawa | 0.0 /100 | #308 | Tragic 13.2% |
| Americans | 0.0 /100 | #309 | Tragic 13.2% |
| Africans | 0.0 /100 | #310 | Tragic 13.2% |
| Sioux | 0.0 /100 | #311 | Tragic 13.2% |
| Blackfeet | 0.0 /100 | #312 | Tragic 13.3% |
| Immigrants | Nicaragua | 0.0 /100 | #313 | Tragic 13.3% |
| Yaqui | 0.0 /100 | #314 | Tragic 13.3% |
| Spanish Americans | 0.0 /100 | #315 | Tragic 13.3% |
| Tsimshian | 0.0 /100 | #316 | Tragic 13.3% |
| Haitians | 0.0 /100 | #317 | Tragic 13.3% |
Demographics Similar to Carpatho Rusyns by Divorced or Separated
In terms of divorced or separated, the demographic groups most similar to Carpatho Rusyns are Danish (11.9%, a difference of 0.0%), Argentinean (11.9%, a difference of 0.020%), Alsatian (11.9%, a difference of 0.060%), Immigrants from Netherlands (11.9%, a difference of 0.060%), and Australian (11.9%, a difference of 0.080%).
| Demographics | Rating | Rank | Divorced or Separated |
| Immigrants | St. Vincent and the Grenadines | 88.4 /100 | #129 | Excellent 11.8% |
| Immigrants | Austria | 88.2 /100 | #130 | Excellent 11.8% |
| Immigrants | Cambodia | 88.2 /100 | #131 | Excellent 11.8% |
| Immigrants | Afghanistan | 87.9 /100 | #132 | Excellent 11.8% |
| New Zealanders | 87.5 /100 | #133 | Excellent 11.9% |
| Argentineans | 85.1 /100 | #134 | Excellent 11.9% |
| Danes | 84.8 /100 | #135 | Excellent 11.9% |
| Carpatho Rusyns | 84.8 /100 | #136 | Excellent 11.9% |
| Alsatians | 84.0 /100 | #137 | Excellent 11.9% |
| Immigrants | Netherlands | 83.9 /100 | #138 | Excellent 11.9% |
| Australians | 83.6 /100 | #139 | Excellent 11.9% |
| Lebanese | 83.4 /100 | #140 | Excellent 11.9% |
| Immigrants | Morocco | 82.9 /100 | #141 | Excellent 11.9% |
| Immigrants | Zimbabwe | 81.5 /100 | #142 | Excellent 11.9% |
| Pakistanis | 81.3 /100 | #143 | Excellent 11.9% |