African vs Immigrants from Australia Divorced or Separated
COMPARE
African
Immigrants from Australia
Divorced or Separated
Divorced or Separated Comparison
Africans
Immigrants from Australia
13.2%
DIVORCED OR SEPARATED
0.0/ 100
METRIC RATING
310th/ 347
METRIC RANK
11.3%
DIVORCED OR SEPARATED
99.9/ 100
METRIC RATING
52nd/ 347
METRIC RANK
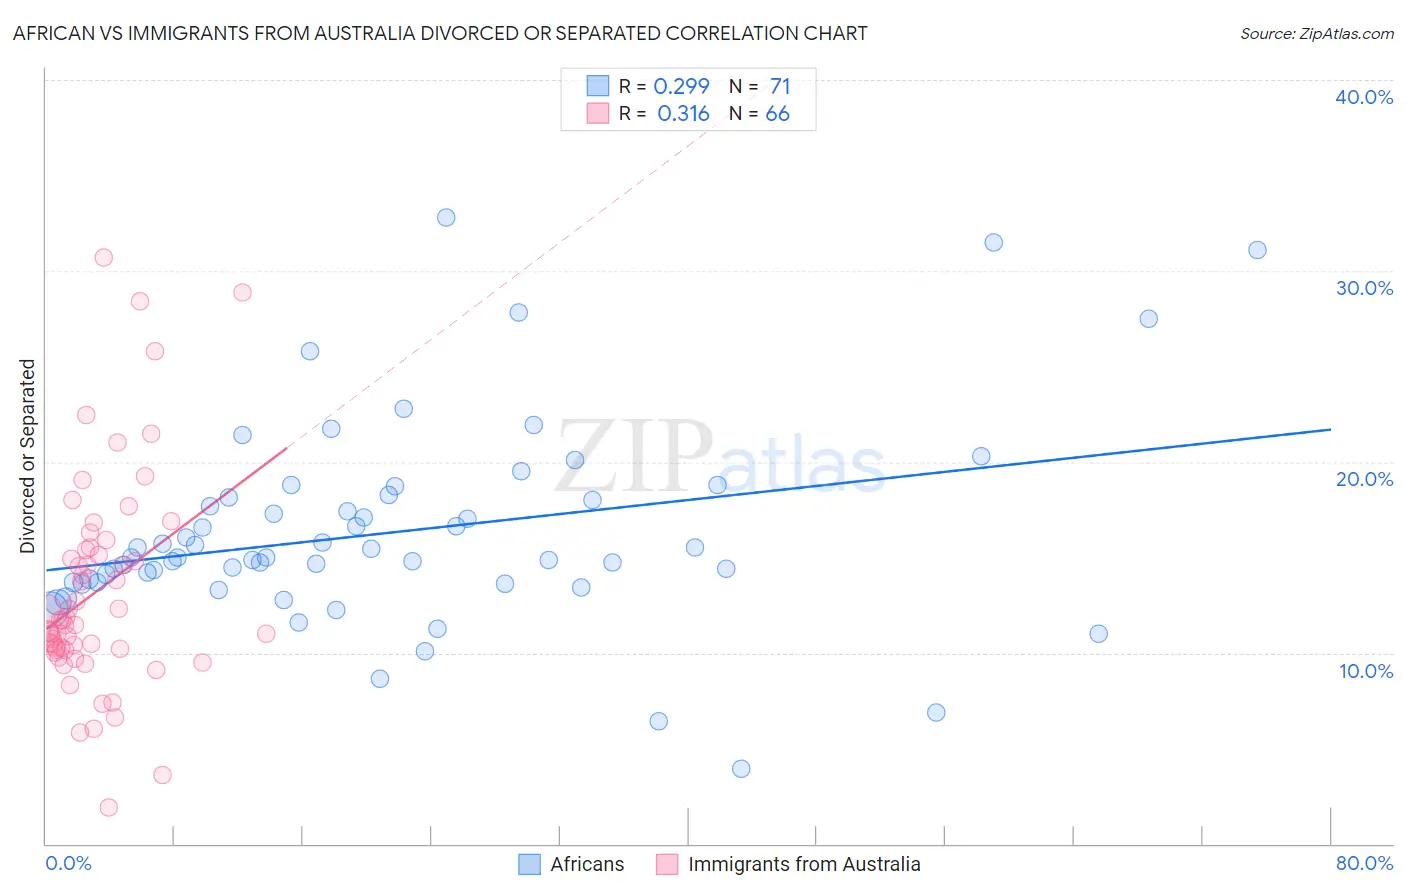
African vs Immigrants from Australia Divorced or Separated Correlation Chart
The statistical analysis conducted on geographies consisting of 469,800,518 people shows a weak positive correlation between the proportion of Africans and percentage of population currently divorced or separated in the United States with a correlation coefficient (R) of 0.299 and weighted average of 13.2%. Similarly, the statistical analysis conducted on geographies consisting of 227,153,682 people shows a mild positive correlation between the proportion of Immigrants from Australia and percentage of population currently divorced or separated in the United States with a correlation coefficient (R) of 0.316 and weighted average of 11.3%, a difference of 17.5%.
Divorced or Separated Correlation Summary
| Measurement | African | Immigrants from Australia |
| Minimum | 3.9% | 1.9% |
| Maximum | 32.8% | 30.7% |
| Range | 28.9% | 28.8% |
| Mean | 16.3% | 13.2% |
| Median | 15.0% | 11.6% |
| Interquartile 25% (IQ1) | 13.7% | 10.2% |
| Interquartile 75% (IQ3) | 18.1% | 15.4% |
| Interquartile Range (IQR) | 4.4% | 5.2% |
| Standard Deviation (Sample) | 5.3% | 5.6% |
| Standard Deviation (Population) | 5.3% | 5.5% |
Similar Demographics by Divorced or Separated
Demographics Similar to Africans by Divorced or Separated
In terms of divorced or separated, the demographic groups most similar to Africans are American (13.2%, a difference of 0.020%), Sioux (13.2%, a difference of 0.020%), Ottawa (13.2%, a difference of 0.030%), French American Indian (13.2%, a difference of 0.12%), and Blackfeet (13.3%, a difference of 0.37%).
| Demographics | Rating | Rank | Divorced or Separated |
| Cape Verdeans | 0.0 /100 | #303 | Tragic 13.1% |
| Hopi | 0.0 /100 | #304 | Tragic 13.2% |
| Chippewa | 0.0 /100 | #305 | Tragic 13.2% |
| Tlingit-Haida | 0.0 /100 | #306 | Tragic 13.2% |
| French American Indians | 0.0 /100 | #307 | Tragic 13.2% |
| Ottawa | 0.0 /100 | #308 | Tragic 13.2% |
| Americans | 0.0 /100 | #309 | Tragic 13.2% |
| Africans | 0.0 /100 | #310 | Tragic 13.2% |
| Sioux | 0.0 /100 | #311 | Tragic 13.2% |
| Blackfeet | 0.0 /100 | #312 | Tragic 13.3% |
| Immigrants | Nicaragua | 0.0 /100 | #313 | Tragic 13.3% |
| Yaqui | 0.0 /100 | #314 | Tragic 13.3% |
| Spanish Americans | 0.0 /100 | #315 | Tragic 13.3% |
| Tsimshian | 0.0 /100 | #316 | Tragic 13.3% |
| Haitians | 0.0 /100 | #317 | Tragic 13.3% |
Demographics Similar to Immigrants from Australia by Divorced or Separated
In terms of divorced or separated, the demographic groups most similar to Immigrants from Australia are Immigrants from Bolivia (11.3%, a difference of 0.11%), Immigrants from Lithuania (11.3%, a difference of 0.23%), Eastern European (11.3%, a difference of 0.34%), Immigrants from Yemen (11.3%, a difference of 0.35%), and Bolivian (11.2%, a difference of 0.40%).
| Demographics | Rating | Rank | Divorced or Separated |
| Turks | 100.0 /100 | #45 | Exceptional 11.2% |
| Laotians | 100.0 /100 | #46 | Exceptional 11.2% |
| Immigrants | Poland | 100.0 /100 | #47 | Exceptional 11.2% |
| Immigrants | Turkey | 100.0 /100 | #48 | Exceptional 11.2% |
| Immigrants | Saudi Arabia | 100.0 /100 | #49 | Exceptional 11.2% |
| Bolivians | 100.0 /100 | #50 | Exceptional 11.2% |
| Immigrants | Bolivia | 100.0 /100 | #51 | Exceptional 11.3% |
| Immigrants | Australia | 99.9 /100 | #52 | Exceptional 11.3% |
| Immigrants | Lithuania | 99.9 /100 | #53 | Exceptional 11.3% |
| Eastern Europeans | 99.9 /100 | #54 | Exceptional 11.3% |
| Immigrants | Yemen | 99.9 /100 | #55 | Exceptional 11.3% |
| Immigrants | Philippines | 99.9 /100 | #56 | Exceptional 11.3% |
| Immigrants | Vietnam | 99.9 /100 | #57 | Exceptional 11.3% |
| Sri Lankans | 99.9 /100 | #58 | Exceptional 11.3% |
| Israelis | 99.9 /100 | #59 | Exceptional 11.3% |