African vs Immigrants from Cameroon Divorced or Separated
COMPARE
African
Immigrants from Cameroon
Divorced or Separated
Divorced or Separated Comparison
Africans
Immigrants from Cameroon
13.2%
DIVORCED OR SEPARATED
0.0/ 100
METRIC RATING
310th/ 347
METRIC RANK
12.3%
DIVORCED OR SEPARATED
8.3/ 100
METRIC RATING
228th/ 347
METRIC RANK
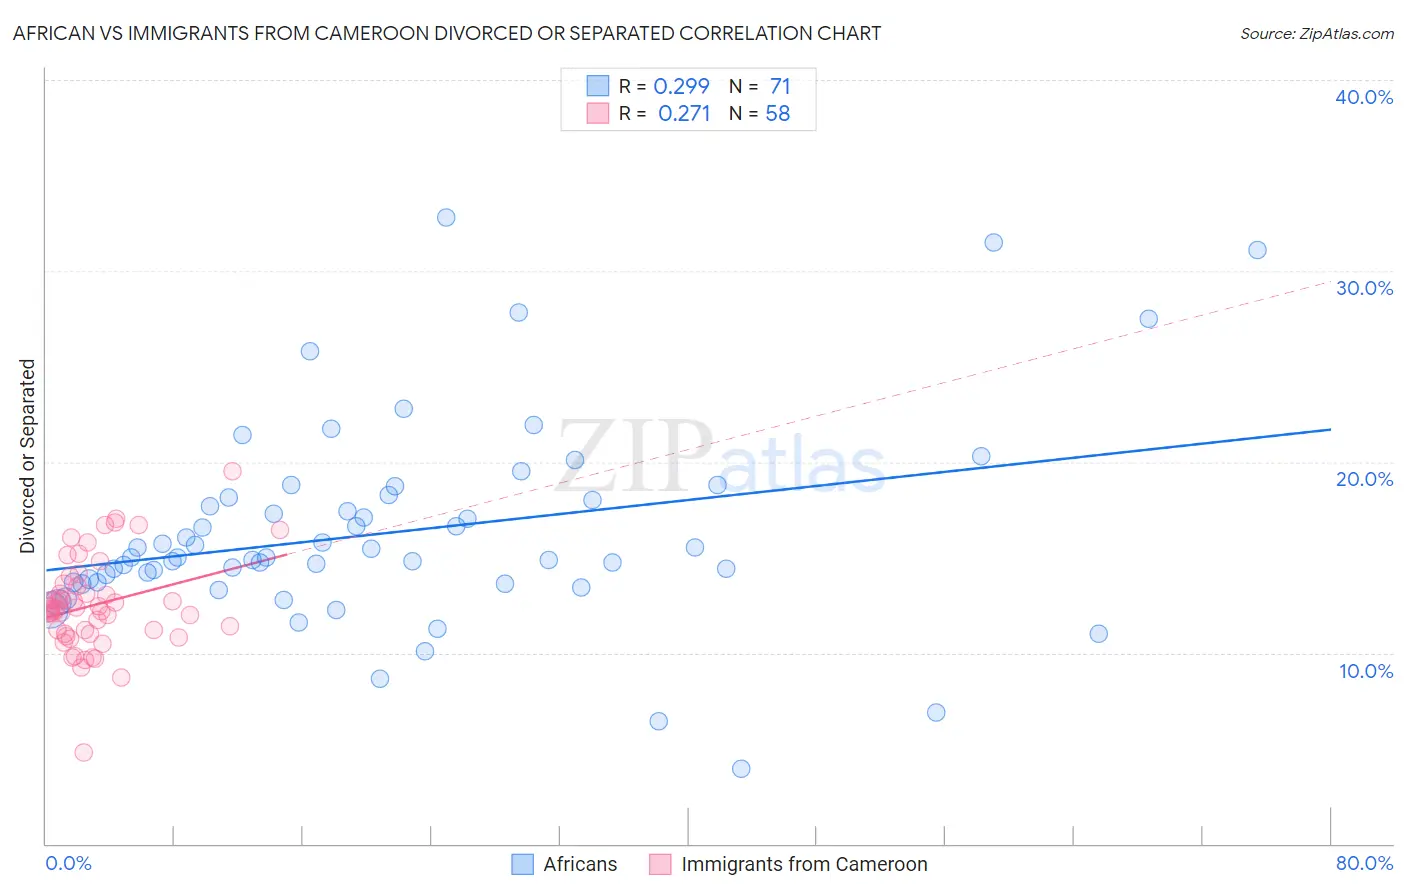
African vs Immigrants from Cameroon Divorced or Separated Correlation Chart
The statistical analysis conducted on geographies consisting of 469,800,518 people shows a weak positive correlation between the proportion of Africans and percentage of population currently divorced or separated in the United States with a correlation coefficient (R) of 0.299 and weighted average of 13.2%. Similarly, the statistical analysis conducted on geographies consisting of 130,744,662 people shows a weak positive correlation between the proportion of Immigrants from Cameroon and percentage of population currently divorced or separated in the United States with a correlation coefficient (R) of 0.271 and weighted average of 12.3%, a difference of 7.5%.
Divorced or Separated Correlation Summary
| Measurement | African | Immigrants from Cameroon |
| Minimum | 3.9% | 4.8% |
| Maximum | 32.8% | 19.5% |
| Range | 28.9% | 14.7% |
| Mean | 16.3% | 12.5% |
| Median | 15.0% | 12.3% |
| Interquartile 25% (IQ1) | 13.7% | 11.0% |
| Interquartile 75% (IQ3) | 18.1% | 13.5% |
| Interquartile Range (IQR) | 4.4% | 2.5% |
| Standard Deviation (Sample) | 5.3% | 2.4% |
| Standard Deviation (Population) | 5.3% | 2.4% |
Similar Demographics by Divorced or Separated
Demographics Similar to Africans by Divorced or Separated
In terms of divorced or separated, the demographic groups most similar to Africans are American (13.2%, a difference of 0.020%), Sioux (13.2%, a difference of 0.020%), Ottawa (13.2%, a difference of 0.030%), French American Indian (13.2%, a difference of 0.12%), and Blackfeet (13.3%, a difference of 0.37%).
| Demographics | Rating | Rank | Divorced or Separated |
| Cape Verdeans | 0.0 /100 | #303 | Tragic 13.1% |
| Hopi | 0.0 /100 | #304 | Tragic 13.2% |
| Chippewa | 0.0 /100 | #305 | Tragic 13.2% |
| Tlingit-Haida | 0.0 /100 | #306 | Tragic 13.2% |
| French American Indians | 0.0 /100 | #307 | Tragic 13.2% |
| Ottawa | 0.0 /100 | #308 | Tragic 13.2% |
| Americans | 0.0 /100 | #309 | Tragic 13.2% |
| Africans | 0.0 /100 | #310 | Tragic 13.2% |
| Sioux | 0.0 /100 | #311 | Tragic 13.2% |
| Blackfeet | 0.0 /100 | #312 | Tragic 13.3% |
| Immigrants | Nicaragua | 0.0 /100 | #313 | Tragic 13.3% |
| Yaqui | 0.0 /100 | #314 | Tragic 13.3% |
| Spanish Americans | 0.0 /100 | #315 | Tragic 13.3% |
| Tsimshian | 0.0 /100 | #316 | Tragic 13.3% |
| Haitians | 0.0 /100 | #317 | Tragic 13.3% |
Demographics Similar to Immigrants from Cameroon by Divorced or Separated
In terms of divorced or separated, the demographic groups most similar to Immigrants from Cameroon are Immigrants from Sudan (12.3%, a difference of 0.020%), Hmong (12.3%, a difference of 0.050%), Yakama (12.3%, a difference of 0.060%), Immigrants from Western Africa (12.3%, a difference of 0.10%), and Immigrants from the Azores (12.3%, a difference of 0.14%).
| Demographics | Rating | Rank | Divorced or Separated |
| Guamanians/Chamorros | 11.3 /100 | #221 | Poor 12.3% |
| Bangladeshis | 10.5 /100 | #222 | Poor 12.3% |
| Scandinavians | 10.4 /100 | #223 | Poor 12.3% |
| Immigrants | Azores | 9.7 /100 | #224 | Tragic 12.3% |
| Belgians | 9.7 /100 | #225 | Tragic 12.3% |
| Immigrants | Western Africa | 9.3 /100 | #226 | Tragic 12.3% |
| Hmong | 8.8 /100 | #227 | Tragic 12.3% |
| Immigrants | Cameroon | 8.3 /100 | #228 | Tragic 12.3% |
| Immigrants | Sudan | 8.2 /100 | #229 | Tragic 12.3% |
| Yakama | 7.8 /100 | #230 | Tragic 12.3% |
| Yugoslavians | 6.6 /100 | #231 | Tragic 12.3% |
| Canadians | 5.3 /100 | #232 | Tragic 12.4% |
| Malaysians | 4.8 /100 | #233 | Tragic 12.4% |
| West Indians | 4.4 /100 | #234 | Tragic 12.4% |
| Immigrants | Bosnia and Herzegovina | 4.3 /100 | #235 | Tragic 12.4% |