African vs Ottawa Divorced or Separated
COMPARE
African
Ottawa
Divorced or Separated
Divorced or Separated Comparison
Africans
Ottawa
13.2%
DIVORCED OR SEPARATED
0.0/ 100
METRIC RATING
310th/ 347
METRIC RANK
13.2%
DIVORCED OR SEPARATED
0.0/ 100
METRIC RATING
308th/ 347
METRIC RANK
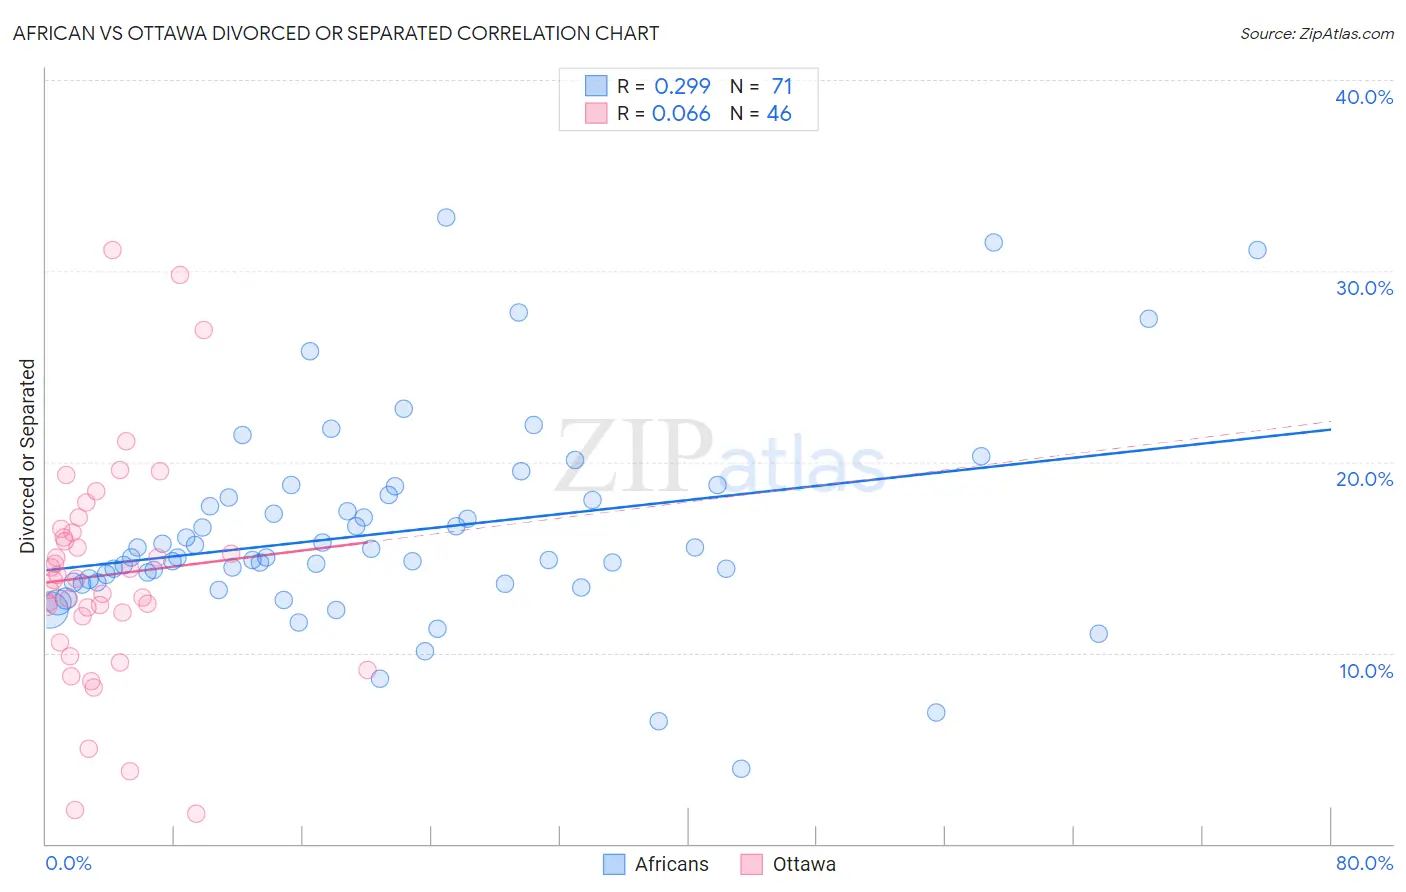
African vs Ottawa Divorced or Separated Correlation Chart
The statistical analysis conducted on geographies consisting of 469,800,518 people shows a weak positive correlation between the proportion of Africans and percentage of population currently divorced or separated in the United States with a correlation coefficient (R) of 0.299 and weighted average of 13.2%. Similarly, the statistical analysis conducted on geographies consisting of 49,956,568 people shows a slight positive correlation between the proportion of Ottawa and percentage of population currently divorced or separated in the United States with a correlation coefficient (R) of 0.066 and weighted average of 13.2%, a difference of 0.030%.
Divorced or Separated Correlation Summary
| Measurement | African | Ottawa |
| Minimum | 3.9% | 1.6% |
| Maximum | 32.8% | 31.1% |
| Range | 28.9% | 29.5% |
| Mean | 16.3% | 14.1% |
| Median | 15.0% | 13.8% |
| Interquartile 25% (IQ1) | 13.7% | 11.9% |
| Interquartile 75% (IQ3) | 18.1% | 16.3% |
| Interquartile Range (IQR) | 4.4% | 4.4% |
| Standard Deviation (Sample) | 5.3% | 6.0% |
| Standard Deviation (Population) | 5.3% | 5.9% |
Demographics Similar to Africans and Ottawa by Divorced or Separated
In terms of divorced or separated, the demographic groups most similar to Africans are American (13.2%, a difference of 0.020%), Sioux (13.2%, a difference of 0.020%), French American Indian (13.2%, a difference of 0.12%), Blackfeet (13.3%, a difference of 0.37%), and Tlingit-Haida (13.2%, a difference of 0.38%). Similarly, the demographic groups most similar to Ottawa are American (13.2%, a difference of 0.010%), Sioux (13.2%, a difference of 0.050%), French American Indian (13.2%, a difference of 0.090%), Tlingit-Haida (13.2%, a difference of 0.34%), and Blackfeet (13.3%, a difference of 0.40%).
| Demographics | Rating | Rank | Divorced or Separated |
| Immigrants | Jamaica | 0.0 /100 | #299 | Tragic 13.0% |
| Immigrants | Cabo Verde | 0.0 /100 | #300 | Tragic 13.1% |
| Alaskan Athabascans | 0.0 /100 | #301 | Tragic 13.1% |
| Immigrants | Venezuela | 0.0 /100 | #302 | Tragic 13.1% |
| Cape Verdeans | 0.0 /100 | #303 | Tragic 13.1% |
| Hopi | 0.0 /100 | #304 | Tragic 13.2% |
| Chippewa | 0.0 /100 | #305 | Tragic 13.2% |
| Tlingit-Haida | 0.0 /100 | #306 | Tragic 13.2% |
| French American Indians | 0.0 /100 | #307 | Tragic 13.2% |
| Ottawa | 0.0 /100 | #308 | Tragic 13.2% |
| Americans | 0.0 /100 | #309 | Tragic 13.2% |
| Africans | 0.0 /100 | #310 | Tragic 13.2% |
| Sioux | 0.0 /100 | #311 | Tragic 13.2% |
| Blackfeet | 0.0 /100 | #312 | Tragic 13.3% |
| Immigrants | Nicaragua | 0.0 /100 | #313 | Tragic 13.3% |
| Yaqui | 0.0 /100 | #314 | Tragic 13.3% |
| Spanish Americans | 0.0 /100 | #315 | Tragic 13.3% |
| Tsimshian | 0.0 /100 | #316 | Tragic 13.3% |
| Haitians | 0.0 /100 | #317 | Tragic 13.3% |
| Cree | 0.0 /100 | #318 | Tragic 13.4% |
| Puget Sound Salish | 0.0 /100 | #319 | Tragic 13.4% |