Immigrants from Central America vs Immigrants from Denmark GED/Equivalency
COMPARE
Immigrants from Central America
Immigrants from Denmark
GED/Equivalency
GED/Equivalency Comparison
Immigrants from Central America
Immigrants from Denmark
76.4%
GED/EQUIVALENCY
0.0/ 100
METRIC RATING
343rd/ 347
METRIC RANK
88.0%
GED/EQUIVALENCY
99.4/ 100
METRIC RATING
56th/ 347
METRIC RANK
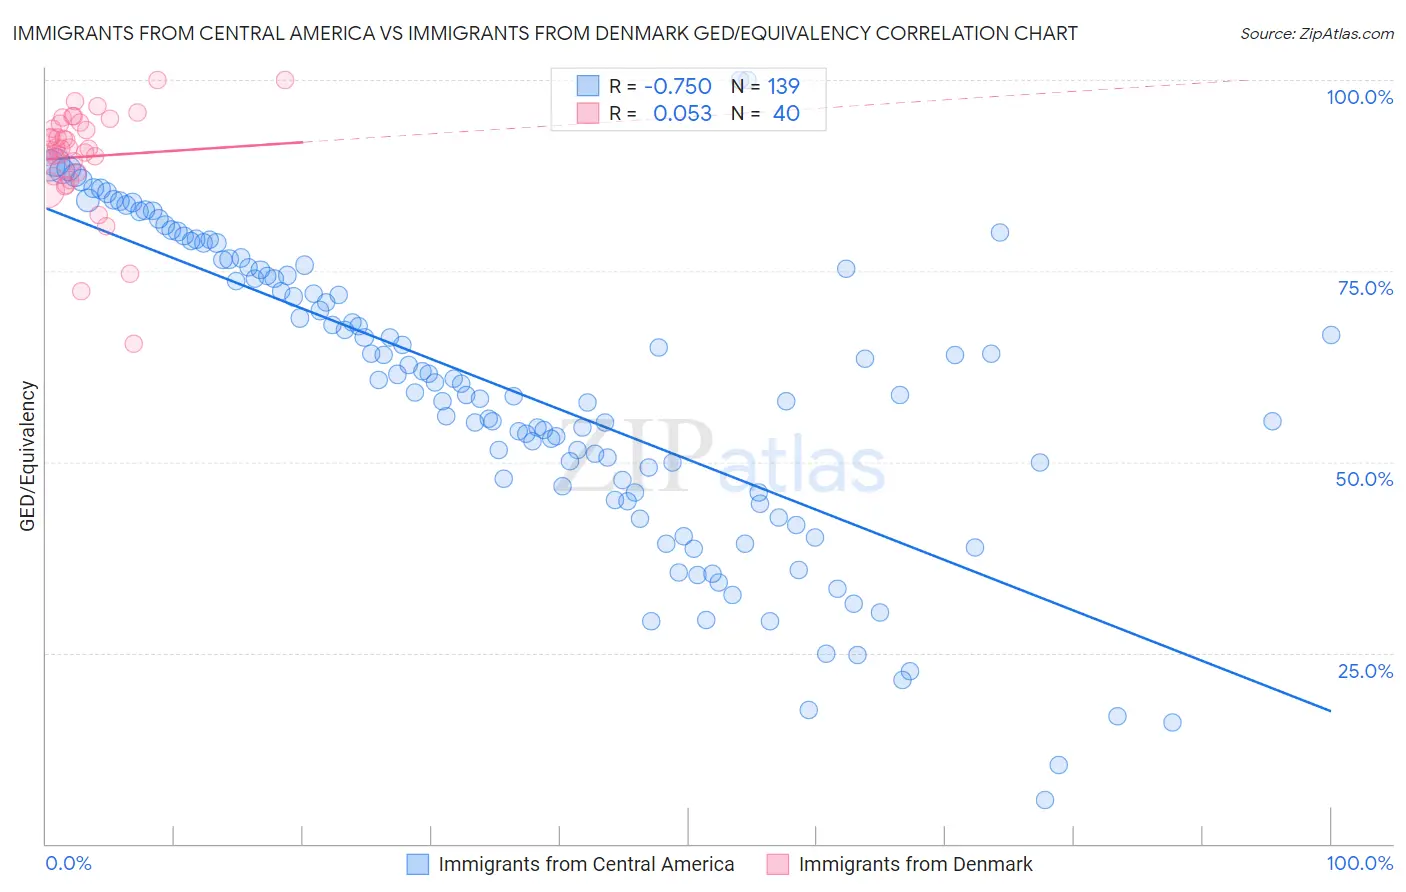
Immigrants from Central America vs Immigrants from Denmark GED/Equivalency Correlation Chart
The statistical analysis conducted on geographies consisting of 536,551,827 people shows a strong negative correlation between the proportion of Immigrants from Central America and percentage of population with at least ged/equivalency education in the United States with a correlation coefficient (R) of -0.750 and weighted average of 76.4%. Similarly, the statistical analysis conducted on geographies consisting of 136,430,715 people shows a slight positive correlation between the proportion of Immigrants from Denmark and percentage of population with at least ged/equivalency education in the United States with a correlation coefficient (R) of 0.053 and weighted average of 88.0%, a difference of 15.2%.
GED/Equivalency Correlation Summary
| Measurement | Immigrants from Central America | Immigrants from Denmark |
| Minimum | 5.7% | 65.5% |
| Maximum | 100.0% | 100.0% |
| Range | 94.3% | 34.5% |
| Mean | 59.4% | 90.0% |
| Median | 60.3% | 91.1% |
| Interquartile 25% (IQ1) | 46.0% | 87.6% |
| Interquartile 75% (IQ3) | 75.4% | 94.3% |
| Interquartile Range (IQR) | 29.5% | 6.7% |
| Standard Deviation (Sample) | 19.9% | 7.0% |
| Standard Deviation (Population) | 19.8% | 6.9% |
Similar Demographics by GED/Equivalency
Demographics Similar to Immigrants from Central America by GED/Equivalency
In terms of ged/equivalency, the demographic groups most similar to Immigrants from Central America are Spanish American Indian (76.3%, a difference of 0.030%), Pima (76.4%, a difference of 0.090%), Immigrants from Mexico (75.7%, a difference of 0.92%), Mexican (77.4%, a difference of 1.4%), and Tohono O'odham (77.5%, a difference of 1.5%).
| Demographics | Rating | Rank | GED/Equivalency |
| Salvadorans | 0.0 /100 | #333 | Tragic 78.6% |
| Guatemalans | 0.0 /100 | #334 | Tragic 78.5% |
| Immigrants | Latin America | 0.0 /100 | #335 | Tragic 78.5% |
| Immigrants | Dominican Republic | 0.0 /100 | #336 | Tragic 78.0% |
| Immigrants | Yemen | 0.0 /100 | #337 | Tragic 77.9% |
| Immigrants | Guatemala | 0.0 /100 | #338 | Tragic 77.9% |
| Immigrants | El Salvador | 0.0 /100 | #339 | Tragic 77.6% |
| Tohono O'odham | 0.0 /100 | #340 | Tragic 77.5% |
| Mexicans | 0.0 /100 | #341 | Tragic 77.4% |
| Pima | 0.0 /100 | #342 | Tragic 76.4% |
| Immigrants | Central America | 0.0 /100 | #343 | Tragic 76.4% |
| Spanish American Indians | 0.0 /100 | #344 | Tragic 76.3% |
| Immigrants | Mexico | 0.0 /100 | #345 | Tragic 75.7% |
| Houma | 0.0 /100 | #346 | Tragic 75.0% |
| Yakama | 0.0 /100 | #347 | Tragic 74.5% |
Demographics Similar to Immigrants from Denmark by GED/Equivalency
In terms of ged/equivalency, the demographic groups most similar to Immigrants from Denmark are Soviet Union (88.0%, a difference of 0.020%), New Zealander (88.0%, a difference of 0.020%), Immigrants from Netherlands (88.0%, a difference of 0.030%), Zimbabwean (88.0%, a difference of 0.030%), and Immigrants from South Africa (88.0%, a difference of 0.030%).
| Demographics | Rating | Rank | GED/Equivalency |
| Australians | 99.5 /100 | #49 | Exceptional 88.1% |
| Immigrants | Korea | 99.5 /100 | #50 | Exceptional 88.1% |
| Immigrants | Netherlands | 99.4 /100 | #51 | Exceptional 88.0% |
| Zimbabweans | 99.4 /100 | #52 | Exceptional 88.0% |
| Immigrants | South Africa | 99.4 /100 | #53 | Exceptional 88.0% |
| Soviet Union | 99.4 /100 | #54 | Exceptional 88.0% |
| New Zealanders | 99.4 /100 | #55 | Exceptional 88.0% |
| Immigrants | Denmark | 99.4 /100 | #56 | Exceptional 88.0% |
| Immigrants | Czechoslovakia | 99.3 /100 | #57 | Exceptional 87.9% |
| Northern Europeans | 99.3 /100 | #58 | Exceptional 87.9% |
| Serbians | 99.3 /100 | #59 | Exceptional 87.9% |
| Scandinavians | 99.3 /100 | #60 | Exceptional 87.9% |
| Europeans | 99.3 /100 | #61 | Exceptional 87.9% |
| Germans | 99.3 /100 | #62 | Exceptional 87.9% |
| Immigrants | Turkey | 99.2 /100 | #63 | Exceptional 87.9% |