Immigrants from Uganda vs Immigrants from Denmark GED/Equivalency
COMPARE
Immigrants from Uganda
Immigrants from Denmark
GED/Equivalency
GED/Equivalency Comparison
Immigrants from Uganda
Immigrants from Denmark
85.7%
GED/EQUIVALENCY
45.2/ 100
METRIC RATING
177th/ 347
METRIC RANK
88.0%
GED/EQUIVALENCY
99.4/ 100
METRIC RATING
56th/ 347
METRIC RANK
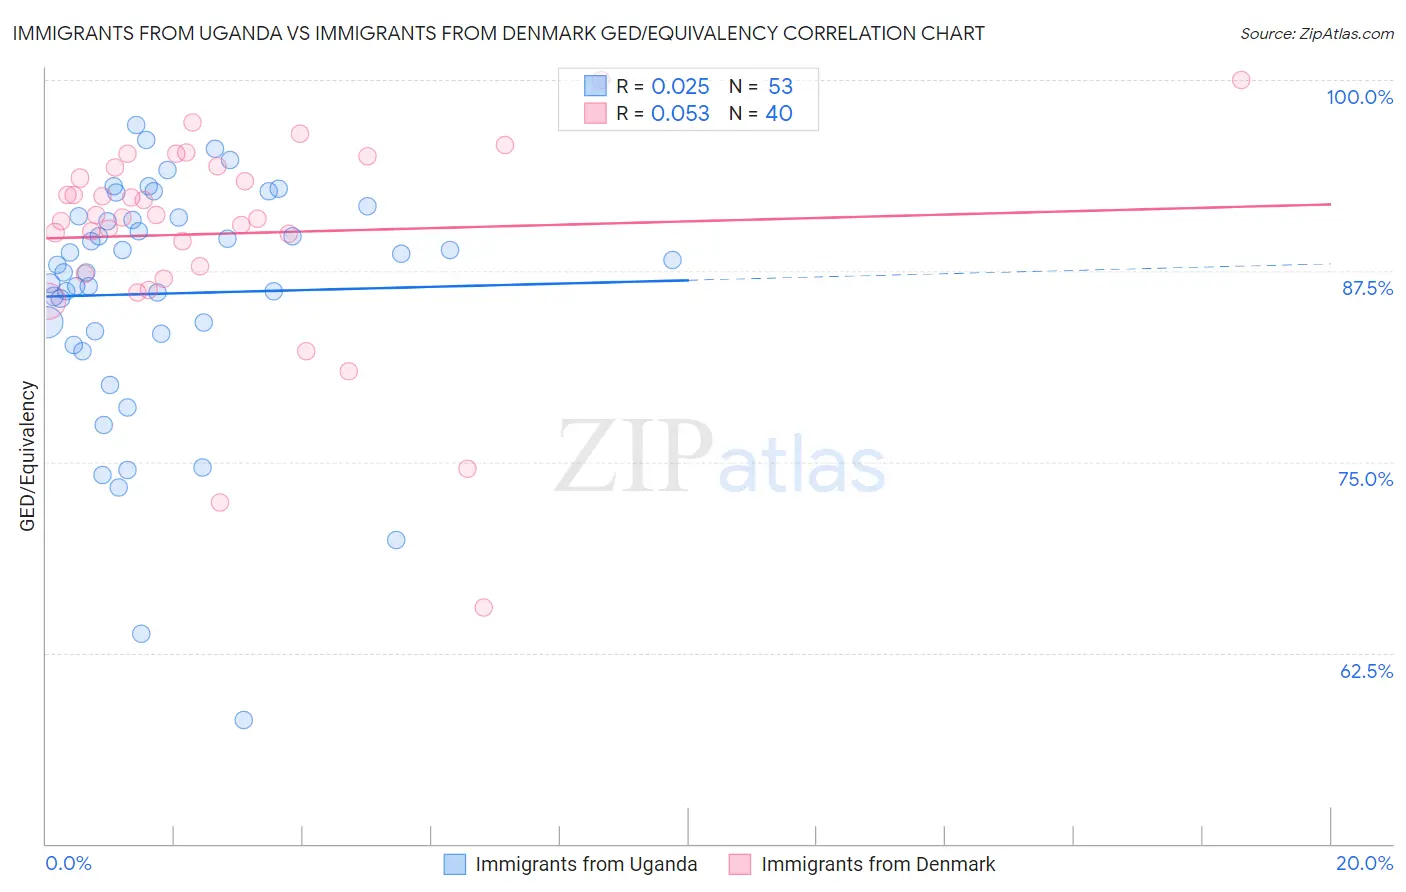
Immigrants from Uganda vs Immigrants from Denmark GED/Equivalency Correlation Chart
The statistical analysis conducted on geographies consisting of 125,982,219 people shows no correlation between the proportion of Immigrants from Uganda and percentage of population with at least ged/equivalency education in the United States with a correlation coefficient (R) of 0.025 and weighted average of 85.7%. Similarly, the statistical analysis conducted on geographies consisting of 136,430,715 people shows a slight positive correlation between the proportion of Immigrants from Denmark and percentage of population with at least ged/equivalency education in the United States with a correlation coefficient (R) of 0.053 and weighted average of 88.0%, a difference of 2.7%.
GED/Equivalency Correlation Summary
| Measurement | Immigrants from Uganda | Immigrants from Denmark |
| Minimum | 58.1% | 65.5% |
| Maximum | 97.1% | 100.0% |
| Range | 39.0% | 34.5% |
| Mean | 86.0% | 90.0% |
| Median | 87.9% | 91.1% |
| Interquartile 25% (IQ1) | 83.5% | 87.6% |
| Interquartile 75% (IQ3) | 91.1% | 94.3% |
| Interquartile Range (IQR) | 7.6% | 6.7% |
| Standard Deviation (Sample) | 8.0% | 7.0% |
| Standard Deviation (Population) | 7.9% | 6.9% |
Similar Demographics by GED/Equivalency
Demographics Similar to Immigrants from Uganda by GED/Equivalency
In terms of ged/equivalency, the demographic groups most similar to Immigrants from Uganda are Immigrants from Eastern Africa (85.7%, a difference of 0.050%), Korean (85.6%, a difference of 0.080%), Ottawa (85.8%, a difference of 0.10%), Immigrants from Bolivia (85.8%, a difference of 0.10%), and Aleut (85.6%, a difference of 0.10%).
| Demographics | Rating | Rank | GED/Equivalency |
| Afghans | 59.7 /100 | #170 | Average 85.9% |
| Immigrants | Chile | 57.3 /100 | #171 | Average 85.9% |
| Bermudans | 55.1 /100 | #172 | Average 85.8% |
| Immigrants | Venezuela | 50.7 /100 | #173 | Average 85.8% |
| Ottawa | 50.0 /100 | #174 | Average 85.8% |
| Immigrants | Bolivia | 49.8 /100 | #175 | Average 85.8% |
| Immigrants | Eastern Africa | 47.7 /100 | #176 | Average 85.7% |
| Immigrants | Uganda | 45.2 /100 | #177 | Average 85.7% |
| Koreans | 41.2 /100 | #178 | Average 85.6% |
| Aleuts | 40.5 /100 | #179 | Average 85.6% |
| Immigrants | Southern Europe | 38.4 /100 | #180 | Fair 85.5% |
| Moroccans | 37.7 /100 | #181 | Fair 85.5% |
| Sudanese | 35.2 /100 | #182 | Fair 85.5% |
| Immigrants | Sudan | 34.2 /100 | #183 | Fair 85.5% |
| Immigrants | Oceania | 33.6 /100 | #184 | Fair 85.5% |
Demographics Similar to Immigrants from Denmark by GED/Equivalency
In terms of ged/equivalency, the demographic groups most similar to Immigrants from Denmark are Soviet Union (88.0%, a difference of 0.020%), New Zealander (88.0%, a difference of 0.020%), Immigrants from Netherlands (88.0%, a difference of 0.030%), Zimbabwean (88.0%, a difference of 0.030%), and Immigrants from South Africa (88.0%, a difference of 0.030%).
| Demographics | Rating | Rank | GED/Equivalency |
| Australians | 99.5 /100 | #49 | Exceptional 88.1% |
| Immigrants | Korea | 99.5 /100 | #50 | Exceptional 88.1% |
| Immigrants | Netherlands | 99.4 /100 | #51 | Exceptional 88.0% |
| Zimbabweans | 99.4 /100 | #52 | Exceptional 88.0% |
| Immigrants | South Africa | 99.4 /100 | #53 | Exceptional 88.0% |
| Soviet Union | 99.4 /100 | #54 | Exceptional 88.0% |
| New Zealanders | 99.4 /100 | #55 | Exceptional 88.0% |
| Immigrants | Denmark | 99.4 /100 | #56 | Exceptional 88.0% |
| Immigrants | Czechoslovakia | 99.3 /100 | #57 | Exceptional 87.9% |
| Northern Europeans | 99.3 /100 | #58 | Exceptional 87.9% |
| Serbians | 99.3 /100 | #59 | Exceptional 87.9% |
| Scandinavians | 99.3 /100 | #60 | Exceptional 87.9% |
| Europeans | 99.3 /100 | #61 | Exceptional 87.9% |
| Germans | 99.3 /100 | #62 | Exceptional 87.9% |
| Immigrants | Turkey | 99.2 /100 | #63 | Exceptional 87.9% |