Yuman vs Immigrants from Denmark Nursery School
COMPARE
Yuman
Immigrants from Denmark
Nursery School
Nursery School Comparison
Yuman
Immigrants from Denmark
97.9%
NURSERY SCHOOL
25.7/ 100
METRIC RATING
197th/ 347
METRIC RANK
98.3%
NURSERY SCHOOL
99.1/ 100
METRIC RATING
84th/ 347
METRIC RANK
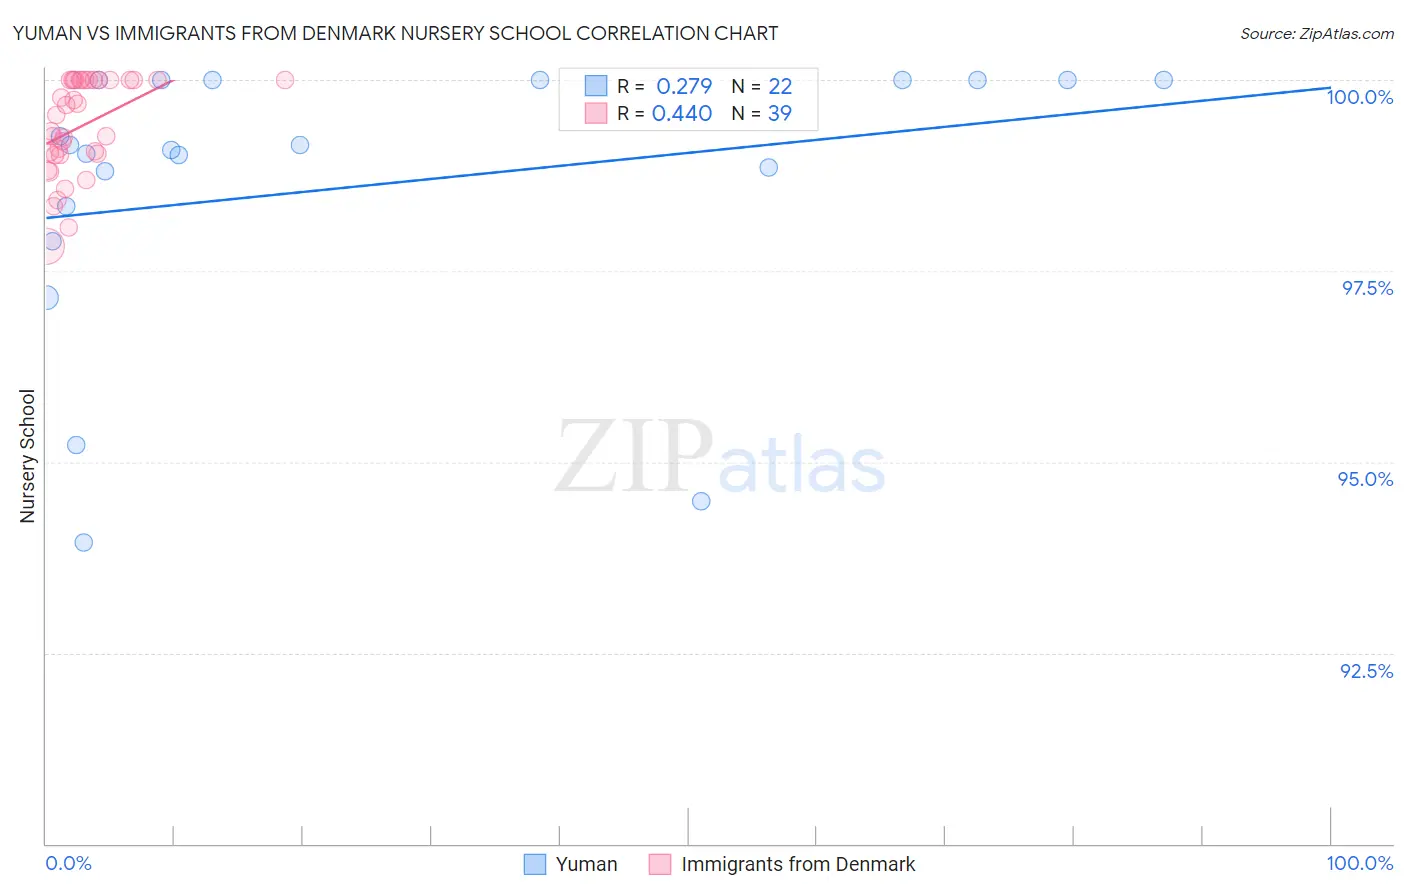
Yuman vs Immigrants from Denmark Nursery School Correlation Chart
The statistical analysis conducted on geographies consisting of 40,696,229 people shows a weak positive correlation between the proportion of Yuman and percentage of population with at least nursery school education in the United States with a correlation coefficient (R) of 0.279 and weighted average of 97.9%. Similarly, the statistical analysis conducted on geographies consisting of 136,428,049 people shows a moderate positive correlation between the proportion of Immigrants from Denmark and percentage of population with at least nursery school education in the United States with a correlation coefficient (R) of 0.440 and weighted average of 98.3%, a difference of 0.43%.
Nursery School Correlation Summary
| Measurement | Yuman | Immigrants from Denmark |
| Minimum | 93.9% | 97.8% |
| Maximum | 100.0% | 100.0% |
| Range | 6.1% | 2.2% |
| Mean | 98.6% | 99.4% |
| Median | 99.1% | 99.5% |
| Interquartile 25% (IQ1) | 98.3% | 99.0% |
| Interquartile 75% (IQ3) | 100.0% | 100.0% |
| Interquartile Range (IQR) | 1.7% | 0.98% |
| Standard Deviation (Sample) | 1.8% | 0.63% |
| Standard Deviation (Population) | 1.8% | 0.62% |
Similar Demographics by Nursery School
Demographics Similar to Yuman by Nursery School
In terms of nursery school, the demographic groups most similar to Yuman are Guamanian/Chamorro (97.9%, a difference of 0.0%), Black/African American (97.9%, a difference of 0.010%), Paraguayan (97.9%, a difference of 0.010%), Mongolian (97.9%, a difference of 0.010%), and Hawaiian (97.9%, a difference of 0.010%).
| Demographics | Rating | Rank | Nursery School |
| Panamanians | 34.3 /100 | #190 | Fair 97.9% |
| Immigrants | Taiwan | 30.6 /100 | #191 | Fair 97.9% |
| Blacks/African Americans | 29.4 /100 | #192 | Fair 97.9% |
| Paraguayans | 27.4 /100 | #193 | Fair 97.9% |
| Mongolians | 27.3 /100 | #194 | Fair 97.9% |
| Hawaiians | 27.2 /100 | #195 | Fair 97.9% |
| Guamanians/Chamorros | 25.7 /100 | #196 | Fair 97.9% |
| Yuman | 25.7 /100 | #197 | Fair 97.9% |
| Immigrants | Kenya | 24.1 /100 | #198 | Fair 97.9% |
| Immigrants | Egypt | 22.5 /100 | #199 | Fair 97.9% |
| Tohono O'odham | 22.2 /100 | #200 | Fair 97.9% |
| Immigrants | Lebanon | 21.2 /100 | #201 | Fair 97.9% |
| Immigrants | Ukraine | 19.9 /100 | #202 | Poor 97.9% |
| Immigrants | Uganda | 18.0 /100 | #203 | Poor 97.9% |
| Immigrants | Southern Europe | 17.4 /100 | #204 | Poor 97.9% |
Demographics Similar to Immigrants from Denmark by Nursery School
In terms of nursery school, the demographic groups most similar to Immigrants from Denmark are Osage (98.3%, a difference of 0.0%), Immigrants from Sweden (98.3%, a difference of 0.0%), Shoshone (98.3%, a difference of 0.010%), Icelander (98.3%, a difference of 0.010%), and Potawatomi (98.3%, a difference of 0.010%).
| Demographics | Rating | Rank | Nursery School |
| Immigrants | Lithuania | 99.3 /100 | #77 | Exceptional 98.3% |
| Delaware | 99.3 /100 | #78 | Exceptional 98.3% |
| Immigrants | Belgium | 99.3 /100 | #79 | Exceptional 98.3% |
| Shoshone | 99.3 /100 | #80 | Exceptional 98.3% |
| Icelanders | 99.2 /100 | #81 | Exceptional 98.3% |
| Potawatomi | 99.2 /100 | #82 | Exceptional 98.3% |
| Osage | 99.1 /100 | #83 | Exceptional 98.3% |
| Immigrants | Denmark | 99.1 /100 | #84 | Exceptional 98.3% |
| Immigrants | Sweden | 99.1 /100 | #85 | Exceptional 98.3% |
| Immigrants | Australia | 99.0 /100 | #86 | Exceptional 98.3% |
| Hopi | 98.9 /100 | #87 | Exceptional 98.3% |
| Ukrainians | 98.9 /100 | #88 | Exceptional 98.3% |
| Immigrants | South Africa | 98.8 /100 | #89 | Exceptional 98.3% |
| Immigrants | Western Europe | 98.8 /100 | #90 | Exceptional 98.3% |
| Zimbabweans | 98.8 /100 | #91 | Exceptional 98.3% |