Yaqui vs Colombian GED/Equivalency
COMPARE
Yaqui
Colombian
GED/Equivalency
GED/Equivalency Comparison
Yaqui
Colombians
80.5%
GED/EQUIVALENCY
0.0/ 100
METRIC RATING
318th/ 347
METRIC RANK
84.9%
GED/EQUIVALENCY
12.3/ 100
METRIC RATING
209th/ 347
METRIC RANK
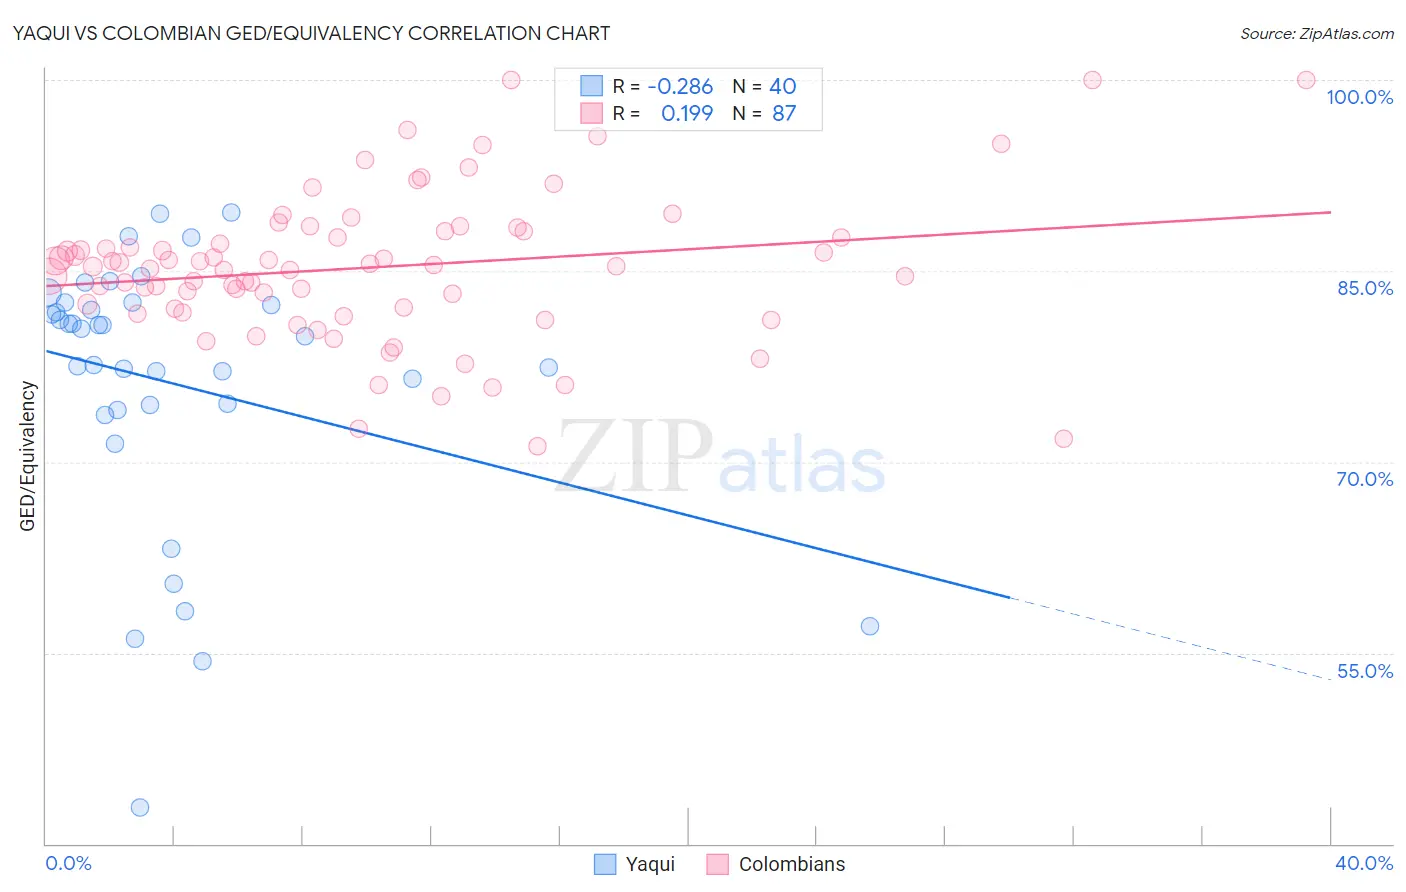
Yaqui vs Colombian GED/Equivalency Correlation Chart
The statistical analysis conducted on geographies consisting of 107,732,380 people shows a weak negative correlation between the proportion of Yaqui and percentage of population with at least ged/equivalency education in the United States with a correlation coefficient (R) of -0.286 and weighted average of 80.5%. Similarly, the statistical analysis conducted on geographies consisting of 419,701,153 people shows a poor positive correlation between the proportion of Colombians and percentage of population with at least ged/equivalency education in the United States with a correlation coefficient (R) of 0.199 and weighted average of 84.9%, a difference of 5.5%.
GED/Equivalency Correlation Summary
| Measurement | Yaqui | Colombian |
| Minimum | 42.9% | 71.3% |
| Maximum | 89.6% | 100.0% |
| Range | 46.7% | 28.7% |
| Mean | 76.2% | 85.3% |
| Median | 80.2% | 85.4% |
| Interquartile 25% (IQ1) | 74.3% | 82.1% |
| Interquartile 75% (IQ3) | 82.4% | 88.1% |
| Interquartile Range (IQR) | 8.1% | 6.0% |
| Standard Deviation (Sample) | 10.6% | 5.8% |
| Standard Deviation (Population) | 10.4% | 5.8% |
Similar Demographics by GED/Equivalency
Demographics Similar to Yaqui by GED/Equivalency
In terms of ged/equivalency, the demographic groups most similar to Yaqui are Immigrants from Belize (80.5%, a difference of 0.0%), Immigrants from Caribbean (80.5%, a difference of 0.020%), Central American Indian (80.6%, a difference of 0.13%), Apache (80.7%, a difference of 0.26%), and Immigrants from Cuba (80.2%, a difference of 0.41%).
| Demographics | Rating | Rank | GED/Equivalency |
| Natives/Alaskans | 0.0 /100 | #311 | Tragic 80.9% |
| Nicaraguans | 0.0 /100 | #312 | Tragic 80.9% |
| Cape Verdeans | 0.0 /100 | #313 | Tragic 80.9% |
| Belizeans | 0.0 /100 | #314 | Tragic 80.9% |
| Apache | 0.0 /100 | #315 | Tragic 80.7% |
| Central American Indians | 0.0 /100 | #316 | Tragic 80.6% |
| Immigrants | Caribbean | 0.0 /100 | #317 | Tragic 80.5% |
| Yaqui | 0.0 /100 | #318 | Tragic 80.5% |
| Immigrants | Belize | 0.0 /100 | #319 | Tragic 80.5% |
| Immigrants | Cuba | 0.0 /100 | #320 | Tragic 80.2% |
| Yup'ik | 0.0 /100 | #321 | Tragic 80.0% |
| Lumbee | 0.0 /100 | #322 | Tragic 80.0% |
| Immigrants | Nicaragua | 0.0 /100 | #323 | Tragic 79.9% |
| Mexican American Indians | 0.0 /100 | #324 | Tragic 79.4% |
| Hondurans | 0.0 /100 | #325 | Tragic 79.3% |
Demographics Similar to Colombians by GED/Equivalency
In terms of ged/equivalency, the demographic groups most similar to Colombians are Marshallese (84.9%, a difference of 0.010%), Immigrants from Cameroon (84.9%, a difference of 0.010%), Hmong (84.9%, a difference of 0.040%), Samoan (84.9%, a difference of 0.060%), and South American (84.8%, a difference of 0.070%).
| Demographics | Rating | Rank | GED/Equivalency |
| Cree | 15.9 /100 | #202 | Poor 85.0% |
| Panamanians | 15.3 /100 | #203 | Poor 85.0% |
| Hawaiians | 15.2 /100 | #204 | Poor 85.0% |
| Liberians | 14.6 /100 | #205 | Poor 85.0% |
| Samoans | 13.7 /100 | #206 | Poor 84.9% |
| Hmong | 13.1 /100 | #207 | Poor 84.9% |
| Marshallese | 12.5 /100 | #208 | Poor 84.9% |
| Colombians | 12.3 /100 | #209 | Poor 84.9% |
| Immigrants | Cameroon | 12.1 /100 | #210 | Poor 84.9% |
| South Americans | 10.9 /100 | #211 | Poor 84.8% |
| Immigrants | Somalia | 10.6 /100 | #212 | Poor 84.8% |
| Immigrants | Philippines | 10.0 /100 | #213 | Poor 84.8% |
| Osage | 9.5 /100 | #214 | Tragic 84.8% |
| Peruvians | 9.2 /100 | #215 | Tragic 84.7% |
| Immigrants | Micronesia | 8.7 /100 | #216 | Tragic 84.7% |